Best Free Online Chart Makers
 By Tony Astor ·
Best Free Online Chart Makers
The best free online chart makers include Canva and Adobe Express for template-driven design, Google Sheets and Datawrapper for live spreadsheet-linked charts, and Flourish and Plotly for animated, interactive, or scientific visualizations. RawGraphs keeps sensitive data local in-browser, while ChartBlocks and Infogram embed responsive, self-updating charts directly into websites.
Table of Contents
Canva
Canva is a go-to resource for people who need polished visuals without formal design training. Its chart-making tools live inside a broader drag-and-drop editor, so anyone preparing a slide deck or social media post can move from raw numbers to a finished graphic within minutes. The platform offers a library of chart types, including bar graphs, pie charts, line graphs, and pictograms, all of which can be inserted directly onto a canvas and customized with a few clicks. Users paste in their data, and Canva renders the visual automatically, adjusting labels, colors, and proportions along the way.
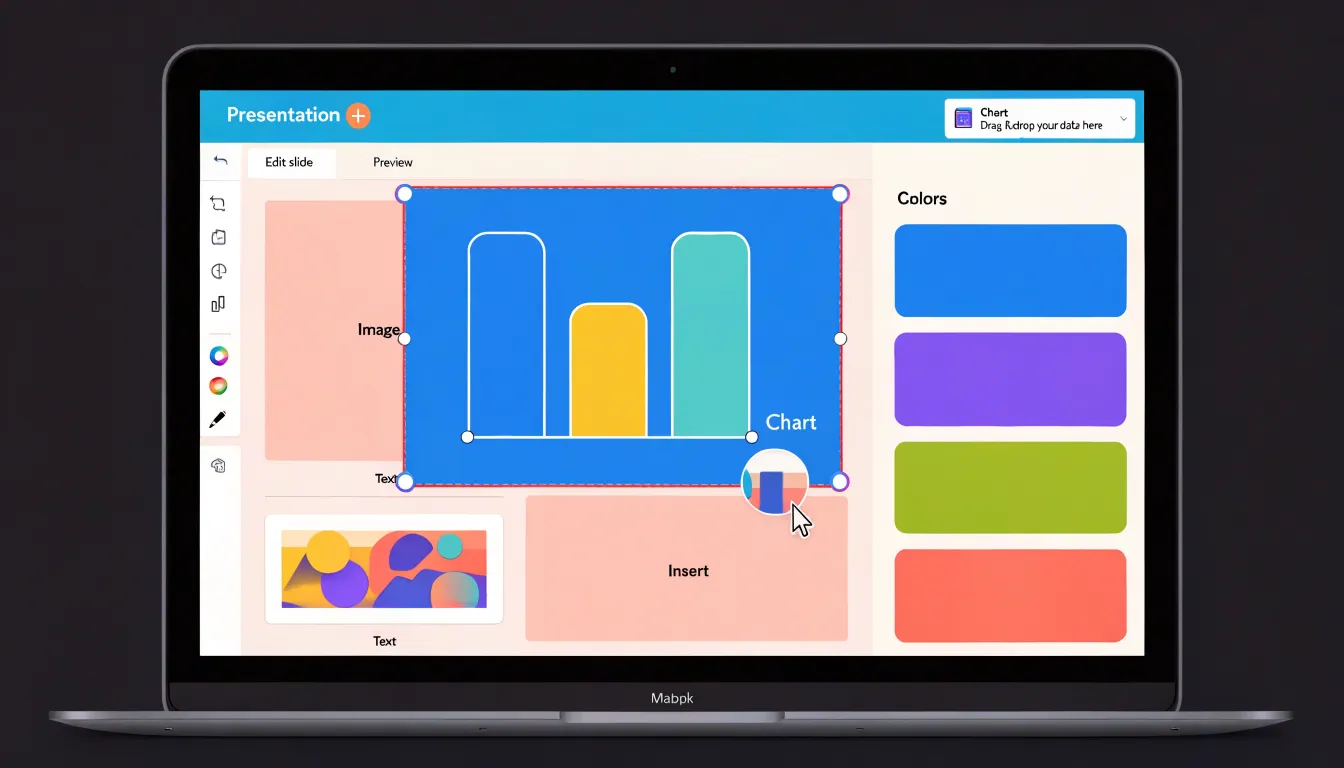
What makes Canva especially approachable for non-designers is the way templates guide the process. Rather than starting from a blank page, users can browse pre-built layouts organized by purpose, such as presentation slides, Instagram posts, or infographics, and then swap in their own statistics. The templates handle spacing, typography, and color harmony, so the result looks intentional even when the person creating it has limited design experience. Drag-and-drop controls let users resize elements, reposition charts, and change palettes to match a brand or personal style.
For presentations, a single chart can be styled to match the surrounding slides, keeping a deck cohesive and easy to follow. For social media, Canva’s preset dimensions remove the guesswork around image sizing, and eye-catching chart styles help data-driven posts stand out in crowded feeds. Users can export finished designs in common formats or share them directly to platforms, giving non-designers a practical path from basic statistics to finished visuals.
Google Sheets
Google Sheets provides a capable charting environment directly inside a spreadsheet, keeping the data you chart and the chart itself linked in the same document. To build a chart, select the range containing your labels and values, then open the Insert menu and choose Chart. Sheets immediately places a chart on the canvas and opens the Chart editor sidebar, where you can swap the chart type, adjust the data range, and fine-tune labels, colors, and axes. Because the chart remains bound to its source cells, editing a number or adding a row updates the visualization without copying or pasting.
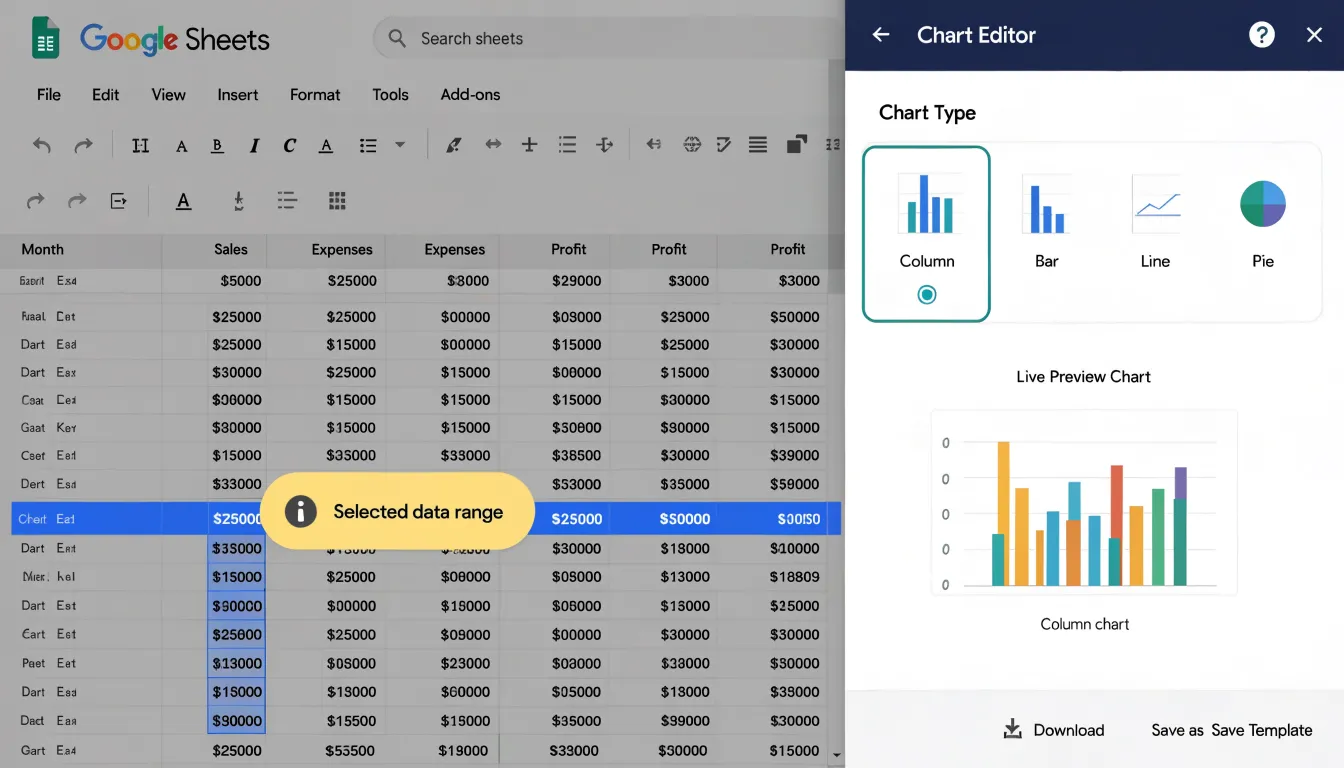
The Chart editor also offers auto-generated suggestions. When a sheet contains well-structured data, Sheets often proposes a chart type through a suggestion prompt near the top of the spreadsheet, and the Setup panel recommends chart types that suit the shape of your data. Common options include column, bar, line, pie, and scatter charts, and each can be refined through the Customize tab to control titles, series formatting, gridlines, and legends.
Integration with Google Workspace adds real-time reporting. Charts can be inserted into Docs and Slides through linked objects, so a chart updated in Sheets refreshes wherever it was embedded. Sharing settings applied to the spreadsheet carry over to collaborators, and multiple people can edit the underlying data simultaneously while viewers watch the chart change. For ongoing reporting, Sheets supports scheduled delivery of charts and dashboards by email, and published charts can be embedded in websites and refreshed automatically. This makes Sheets a practical choice for teams that want clean, current visuals built from live data without leaving their existing workflow.
Visme
Visme is a free online chart maker that gives users the tools to move beyond static graphs and create interactive dashboards suited to corporate reporting. The platform provides a range of chart types, including bar, line, pie, and area charts, which can be assembled into a single dashboard canvas. Each chart connects to data entered manually or imported from spreadsheets, so the visuals update as the underlying figures change. This makes Visme useful for teams that need to refresh quarterly results or monthly performance summaries without rebuilding the layout from scratch.
Interactivity is a core feature of Visme dashboards. Users can add clickable widgets that let viewers explore the data rather than simply read it. Hover effects reveal precise values, links guide audiences to related sections, and pop-ups can surface additional context, such as definitions, methodology notes, or breakdowns of a particular metric. These elements turn a standard report into something an audience can navigate at its own pace, which is especially helpful during presentations where stakeholders want to dig into specific figures.
Visme also supports multiple output formats. Finished dashboards and individual charts can be downloaded as images, PDFs, or PowerPoint files, making them easy to slot into corporate decks or distribute by email. Interactive versions can be shared through a link, allowing recipients to engage with the widgets and pop-ups directly in a browser. For companies producing investor updates, internal briefings, or annual reports, this combination of dynamic visualization and flexible export options suits both live and asynchronous review.
Infogram
Infogram gives publishers and communications teams a direct path from a spreadsheet to a live visual inside a web page. You begin by choosing a chart or map template from the library, then connect it to the data you want to display. Rather than exporting a static image each time the numbers change, you paste in a link to a hosted spreadsheet or upload a file to the project, and the visual reads from that source whenever it is viewed. When the source data is updated, the chart or map on your page updates as well, so a dashboard showing weekly traffic figures stays current without anyone touching the design.
Through the drag-and-drop editor, you can restyle colors to match a brand palette, adjust axis labels and legends, add a title and annotations, and switch between chart types. Maps work the same way, using region or country codes from your dataset to shade areas according to a chosen value. Once the design is final, Infogram provides an embed code to paste into your content management system. The chart renders as an interactive element, with tooltips on hover and, on larger charts, the option for viewers to toggle data series on and off.
Embeddable visuals also support scheduled refreshes, so a connected sheet can be set to pull new figures at a regular interval. This suits recurring reporting such as monthly engagement statistics, election results, or budget tracking. For teams producing regular content, saving a project as a template means future charts inherit the same styles and data connections, keeping the chart a permanent, self-updating feature of the page rather than a one-off graphic.
Venngage
Venngage is built around storytelling, and its free tier gives users access to a library of templates designed specifically for social media distribution. When you open the editor, you begin with pre-built layouts sized for platforms where your audience spends time, including square and vertical formats that suit LinkedIn feeds and Twitter timelines. The template collection covers common engagement formats such as listicles, timelines, comparison grids, and data-driven snapshots, each structured to guide a reader from one point to the next.
Dragging in your own copy and swapping icons or color palettes takes only a few minutes, and the interface updates your canvas in real time so you can judge how the finished piece will read at a glance. The platform emphasizes visual hierarchy, encouraging you to lead with a strong headline and supporting statistic before presenting secondary details, which matters when a viewer is scrolling quickly past dozens of posts. Charts and pictograms can be inserted to translate numbers into shapes that audiences absorb faster than raw figures.
Export options on the free plan support sharing directly to your channels, and finished designs can be downloaded as image files suitable for posting. For teams building a consistent presence, saved brand elements help you reuse colors and fonts across multiple graphics so your feed feels cohesive. The drag-and-drop canvas requires no design software experience, making it practical for marketers, community managers, and small business owners who need to publish regularly without a dedicated designer on hand.
Piktochart
Piktochart offers a focused set of tools for converting financial metrics and business statistics into presentation-ready visuals specifically designed for startup investor decks. The platform includes templates that mirror the structure of pitch decks, with pre-built layouts for traction slides, market size charts, and revenue projections. Users can input raw numbers from spreadsheets or manually enter data, and Piktochart generates charts, graphs, and infographics that match the visual style of the deck. The editor allows customization of colors, fonts, and chart types to align with a startup’s branding, ensuring consistency across slides.
For investor decks, clarity and speed of comprehension are critical, so Piktochart emphasizes clean, uncluttered designs that highlight key figures. The tool also provides icons and illustrations that can be paired with data points to reinforce the narrative, such as using a growth arrow for user acquisition or a pie chart for market segmentation.
Since startup founders often need to iterate quickly, Piktochart supports real-time collaboration and easy sharing, enabling teams to refine visuals together. Export options include PDF and PNG, which are standard formats for pitch decks. While Piktochart is not a dedicated financial modeling tool, it bridges the gap between raw data and presentation aesthetics, helping founders without design backgrounds present their numbers in a professional manner that conveys business potential.
Adobe Express
Adobe Express offers a streamlined approach to chart creation for beginners. Its pre-designed templates feature balanced layouts and typography: select a template that matches the desired chart type—such as bar, pie, or line—and replace the placeholder data with your own. This eliminates the need to manually adjust axes, labels, or legends, which can be time-consuming for new users.
Beyond templates, Adobe Express includes branding tools that maintain consistency with existing visual identities. Users can upload their brand colors, fonts, and logos, and apply them to charts with a few clicks, aligning simple visualizations with broader marketing materials or presentations. Sliders and color pickers allow for adjustments without requiring knowledge of design principles; changing a chart’s color scheme to match a company palette is a matter of selecting from a saved library rather than manually editing each element.
The platform’s focus on speed and ease of use suits quick turnarounds. Users can go from raw data to a branded graphic in minutes for social media posts, reports, or presentations where time is limited. The interface guides users through each step, reducing the likelihood of errors and removing the technical barriers typically associated with chart design.
ChartBlocks
ChartBlocks focuses on embedding responsive charts directly into websites without heavy development work. The platform generates lightweight charts that load quickly and adapt to different screen sizes. Users create charts within the ChartBlocks editor, then publish them to a hosted URL or embed them using a simple HTML snippet. This embed code works with standard websites, blogs, and content management systems, allowing charts to sit alongside text or other media without disrupting the layout.
Responsive design ensures that charts automatically resize and remain legible on smartphones, tablets, and desktops, which is useful for bloggers and small business owners who do not want to maintain separate mobile versions. ChartBlocks handles the hosting and delivery of the chart, so users do not need to worry about server configuration or bandwidth. The embedded charts are interactive, featuring tooltips and hover effects.
Because the charts render as lightweight elements, they have minimal impact on page load times, which matters for user experience and search engine rankings. The platform supports bar, line, pie, and scatter plots, and allows customization of colors, labels, and axes to match a site’s branding. Integration requires no coding knowledge beyond pasting the provided embed code into a site’s HTML.
Flourish
Flourish is built around animations and interactivity, finding a natural home in newsrooms, editorial teams, and media organizations that need to hold a reader’s attention from the first frame to the last. Its signature offering is the animated race chart, also known as a bar chart race, in which ranked bars shift and reorder over time to show how leaders change across months or years. Watching a category climb from mid-table to first place communicates momentum and surprise in a way a static table rarely manages.
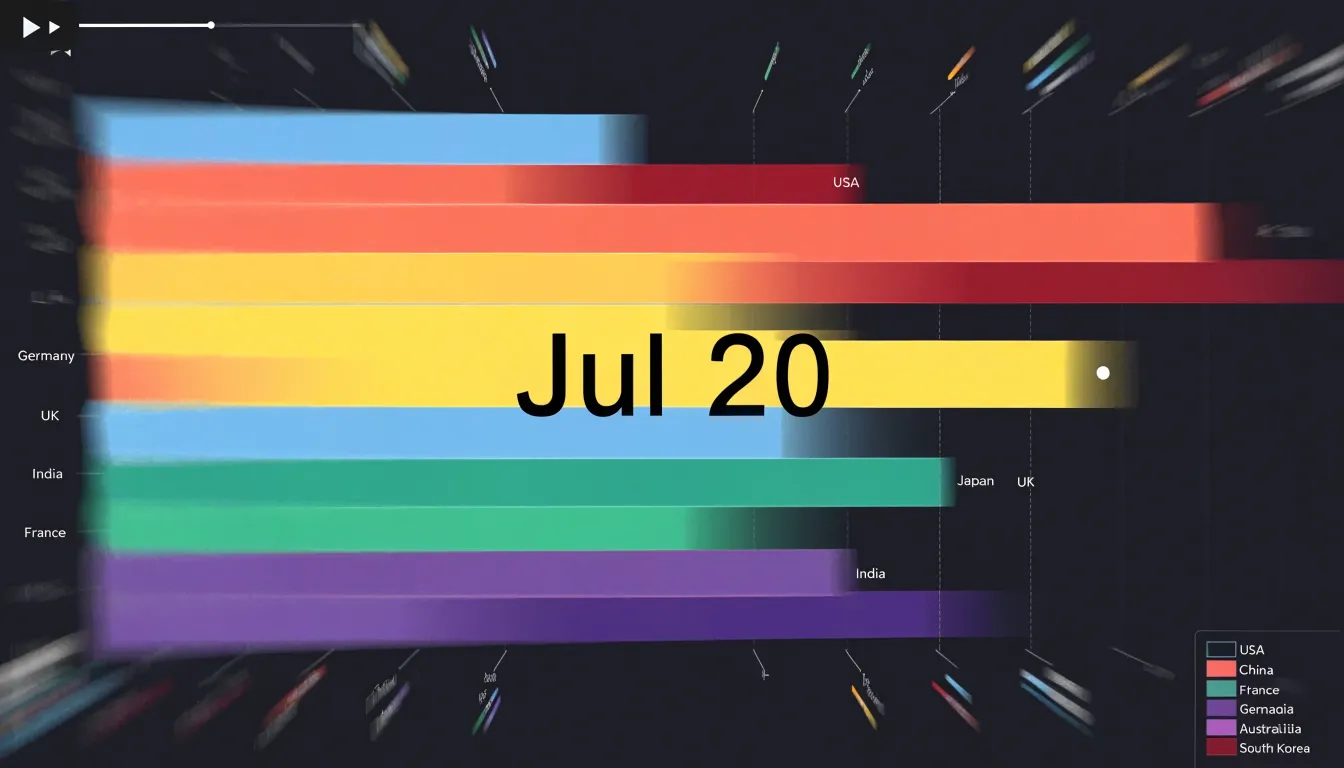
Beyond race charts, Flourish supports animated scatter plots that trace individual data points along a timeline, revealing clusters, outliers, and divergences as they emerge. Smooth transitions and scroll-driven storytelling let editors guide viewers through a narrative sequence rather than presenting a single frozen snapshot. Many templates are designed for embedding, so a chart can sit inside an article and respond to hovering, clicking, or scrolling.
The free tier covers a generous range of templates and public projects, which suits bloggers, students, and small editorial teams testing ideas. Through template-driven creation, users select a chart type, paste or connect data, and adjust labels and styling without writing code, lowering the barrier for journalists and content creators working from a spreadsheet.
Datawrapper
Datawrapper is built with journalists and researchers in mind, turning raw data into clean, publication-ready charts without coding. It uses a simple three-step workflow: upload data, check and refine the chart, and publish.
- Upload data: Upload a CSV file or paste data directly into the tool. Datawrapper automatically detects data types and suggests suitable chart types, such as bar, line, or pie charts, alongside more advanced options like scatter plots, maps, and tables.
- Check and refine: Customize the chart’s appearance by adjusting colors, labels, axes, and annotations. Design presets automatically format numbers and dates and ensure accessibility through proper contrast and alt text.
- Publish: Embed the chart on any website or share a link.
Charts are responsive across desktop and mobile screens and are optimized for loading speed and accessibility, including keyboard navigation and screen reader support. Datawrapper is popular among newsrooms because it handles the technical details of chart rendering and hosting. The free tier includes unlimited charts and views, with options to export as PNG, SVG, or PDF, allowing researchers to quickly visualize survey results or experimental data for reports and papers.
RawGraphs
RawGraphs is a browser-based tool for visualizing complex datasets without uploading sensitive information to remote servers. Because it operates entirely within your web browser, your data stays on your local machine throughout the process, eliminating the risk of data breaches associated with cloud-based services for professionals handling confidential or proprietary data.
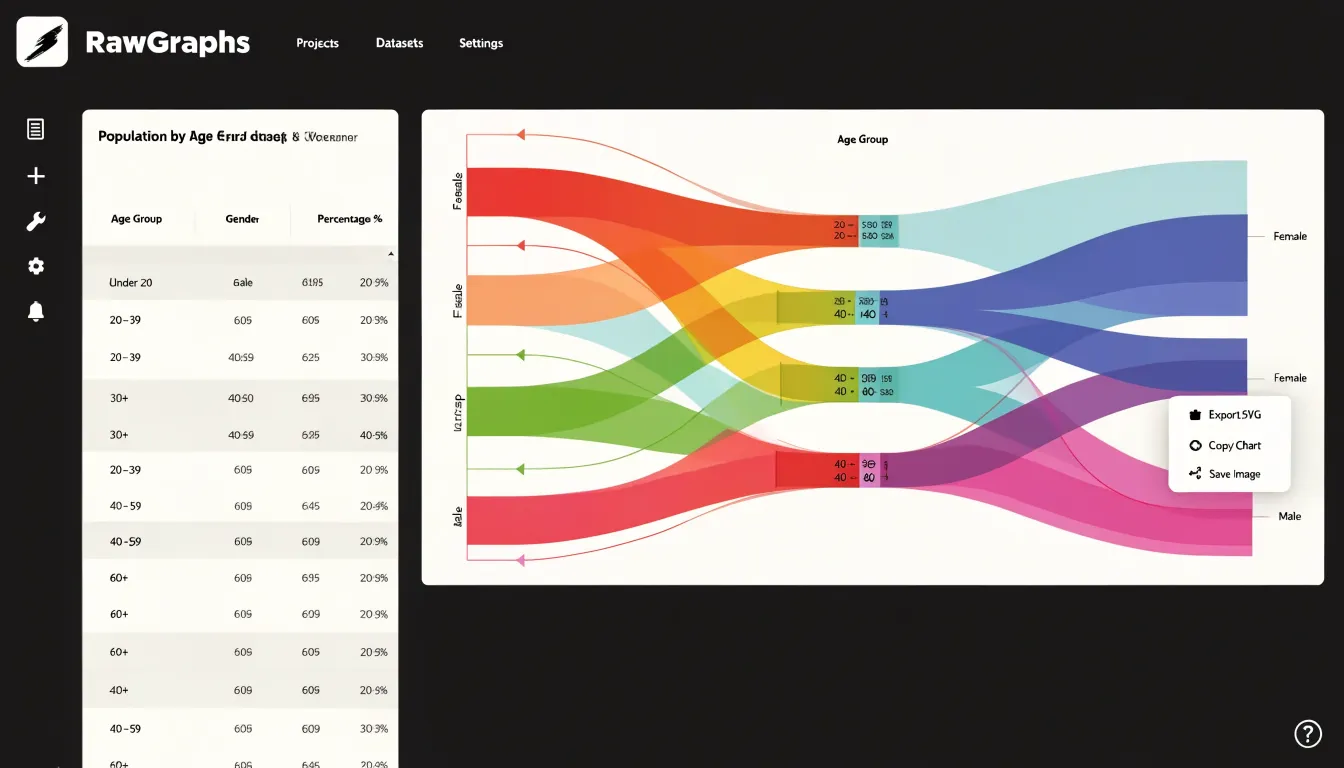
To get started, open RawGraphs in your browser and load a dataset in CSV, TSV, or JSON format. The interface provides chart types ranging from basic bar and line charts to advanced visualizations like alluvial diagrams and circular dendrograms. Once you select and customize your chart, you can export the result as an SVG (Scalable Vector Graphics) file, a vector format that preserves quality at any size and suits further editing in software such as Adobe Illustrator or Inkscape.
RawGraphs also enables you to open and view SVG files directly in your web browser, so you can preview your visualization instantly or share the file with colleagues to view in any modern browser without additional software. Because the entire workflow—from data import to chart creation to SVG export and preview—happens locally, researchers, journalists, and business analysts can iterate on sensitive datasets in private.
Plotly
Plotly was built for the quantitative and scientific visualizations that arise in engineering, physics, mathematics, and statistical research, where ordinary business charts rarely suffice. Users can generate high-precision 3D plots that render surfaces, scatter clouds, and contour maps with fine control over axes, camera angles, and lighting, making it possible to inspect complex spatial data from multiple perspectives. Statistical diagrams cover exploratory analysis needs, including histograms, box plots, violin plots, heatmaps, and distribution charts that update as underlying data changes. Mathematical representations are equally well supported, with tools for plotting functions, parametric curves, and surfaces directly from equations.
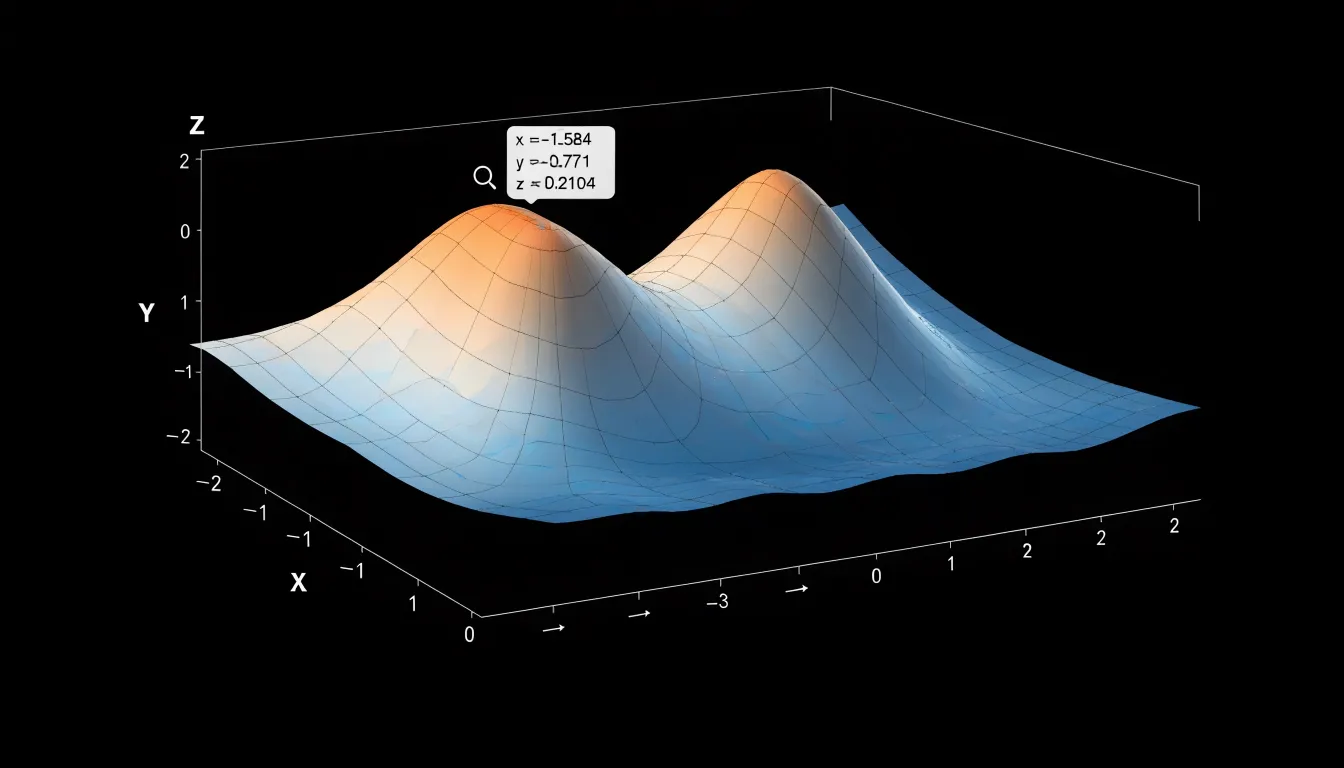
Precision is a central strength: axis ranges, tick spacing, logarithmic scales, and numeric formatting can all be adjusted to match publication standards, and hover readouts display exact values for individual data points. The charting engine renders interactive graphics that let viewers zoom, pan, and isolate series, which is valuable when examining dense datasets or noisy measurements.
Because Plotly integrates with Python, R, and JavaScript, researchers can move seamlessly between analysis notebooks and shareable web charts, while the free online editor offers a no-code path for those who prefer a visual interface. Export options include high-resolution images and embeddable HTML for reports, papers, and dashboards.
Lucidchart
Lucidchart specializes in mapping out complicated systems and structures. It shines with flowcharts and organizational diagrams, offering a deep library of shapes, connectors, and templates that cover everything from simple decision trees to intricate multi-step process diagrams. Users who need to document how a system works, trace the path of a request through a workflow, or visualize reporting lines across departments can use these building blocks rather than starting from a blank canvas.
A core strength of Lucidchart is real-time collaboration. Multiple team members can work on the same diagram simultaneously, leaving comments, making edits, and seeing changes appear instantly. This helps distributed teams brainstorm a process together or refine an organizational chart during a live meeting. Version history and sharing controls add accountability, so stakeholders can review diagrams and suggest improvements without stepping on each other’s work.
For process mapping, Lucidchart supports standard notations and smart connectors that snap into place, keeping complex diagrams readable. Organizational charts can be built manually or generated from imported data, saving time when team structures change frequently. The free tier allows a generous number of documents and objects, making it a practical choice for individuals and small teams testing the tool before committing to a paid plan.
Mind the Graph
Mind the Graph serves researchers, academics, and students who need visuals that meet the standards of scholarly publishing. The platform centers on a library of scientifically accurate illustrations covering subjects such as molecular biology, anatomy, cellular processes, and laboratory equipment. Researchers can assemble diagrams—such as a cell signaling pathway—from pre-made components that reflect accepted scientific conventions, saving the time and cost of commissioning custom artwork while maintaining biological plausibility.
Chart and graph formats are optimized for academic contexts. Outputs can be tailored for research papers, where figures must fit column widths and meet journal resolution requirements, as well as for poster presentations, which call for larger canvases and bolder visual hierarchies that read well from a distance. Export options are designed around journal submission guidelines for image size, labeling, and file format, reducing figure revisions during peer review.
Beyond individual figures, Mind the Graph supports graphical abstracts—visual summaries that increasingly accompany journal articles and grant applications. Combining an illustration library, editable templates, and research-oriented chart types, it offers academics a focused alternative to general-purpose design software.
Overview
Choosing the right free chart maker starts with comparing what each tool actually offers, since “free” plans vary widely in scope. Some platforms provide a broad set of chart types—bar, line, pie, scatter, area, and specialized formats like radar or treemap—while others concentrate on a narrow selection. Before committing to a tool, take inventory of your dataset: its size, the number of variables to display, and whether the data updates frequently or remains static. A small spreadsheet of sales figures calls for a different approach than a multi-series time comparison or a geographic breakdown.
Export options deserve equal attention:
- PNG or JPEG: Suits presentations and social posts.
- SVG or PDF: Preserves sharpness at any scale for print, academic papers, or professional reports.
- Embed links or iframes: Works best for interactive dashboards and websites.
Check early whether exports are gated behind a paywall or watermarked, since that can undercut a free plan.
Finally, weigh the learning curve against how often you will use the tool. Drag-and-drop interfaces with spreadsheet-style entry let beginners produce a chart in minutes, while more capable tools may require familiarity with data formatting conventions, styling panels, or light scripting. A tool that takes longer to learn may pay off if it handles your recurring charting needs with greater flexibility. Matching these three dimensions—features, export formats, and ease of use—against your dataset will point you to the best fit.
Frequently Asked Questions
Which free chart maker is good for non-designers or beginners?
Canva is described as especially approachable for non-designers, with drag-and-drop tools and templates. Adobe Express is also presented as a streamlined chart-creation option for beginners.
Can Google Sheets charts update automatically when I change the data?
Yes. Google Sheets charts remain bound to their source cells, so editing a number or adding a row updates the visualization without copying or pasting.
Which free chart maker is good for interactive dashboards?
Visme is described as a free online chart maker for building interactive dashboards suited to corporate reporting. Its charts can connect to data entered manually or imported from spreadsheets so visuals update as figures change.
Do Infogram charts update automatically when the source data changes?
Yes. Infogram visuals can read from a hosted spreadsheet or uploaded file, update when source data changes, and embedded visuals can support scheduled refreshes.
What is Flourish used for?
Flourish is built around animations and interactivity, including animated race charts and animated scatter plots. Its free tier covers a range of templates and public projects.
Which chart maker keeps my data in my browser instead of uploading it?
RawGraphs operates entirely within your web browser, so your data stays on your local machine throughout the process. It can export the finished chart as an SVG file.
Tony Astor
Tony writes about data visualization and the tools people use to build charts and dashboards. More about Data Illustrator