Best Data Visualization Books for Beginners and Practitioners
 By Tony Astor ·

Best Data Visualization Books for Beginners and Practitioners
The best data visualization books for beginners cover chart fundamentals, data storytelling, dashboard design, color theory, and truthful charting, while practitioner-level titles add Python, R, D3.js, GIS mapping, accessibility, and business intelligence. Foundational texts teach chart selection, visual encoding, narrative structure, advanced books build production, governance, and portfolio skills.
Table of Contents
Data Visualization Fundamentals
Building a solid foundation in data visualization starts with understanding the vocabulary of the field: the basic chart types, the reasons each one exists, and the situations in which each communicates most effectively. The core books in this category take readers through bar charts, line charts, scatter plots, histograms, and pie charts, explaining the perceptual logic behind each form and the kinds of data relationships they are suited to reveal. Readers learn how position, length, angle, area, and color encode values, and why some encodings are read more accurately than others.
Chart selection frameworks form a second pillar of these foundational texts. Rather than leaving chart choice to intuition, the best beginner books offer structured guidance: identify the question the chart must answer, classify the data by type and number of variables, then match the relationship being shown to an appropriate visual form. These frameworks help readers move from a vague sense of what looks right to a defensible rationale for each design decision.
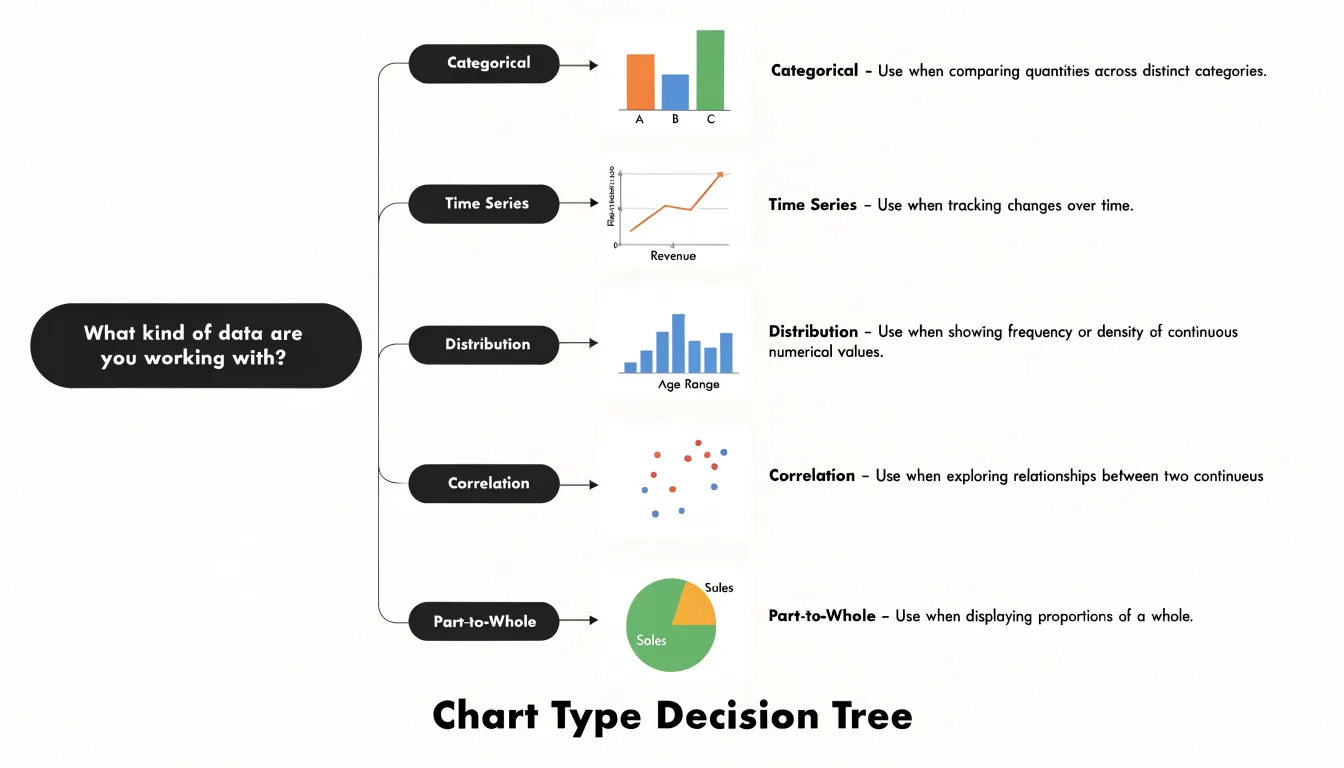
A third element is foundational visual syntax—the grammar of layout, scale, axis treatment, labeling, and annotation that determines whether a chart reads cleanly. The essential reads in this group cover how to use color purposefully, how to order categories meaningfully, how to avoid distortion in scales, and how to write titles and labels that guide interpretation. Practitioners come away with a working checklist they can apply to any chart before publishing it.
Data Storytelling
A technically correct chart often fails to move an audience, while a well-told data story can change the direction of a meeting and, eventually, a business decision. The books in this category focus on that gap between analysis and persuasion, teaching readers how to build narrative arcs, sequence insights, and frame findings so decision-makers can act on them with confidence.
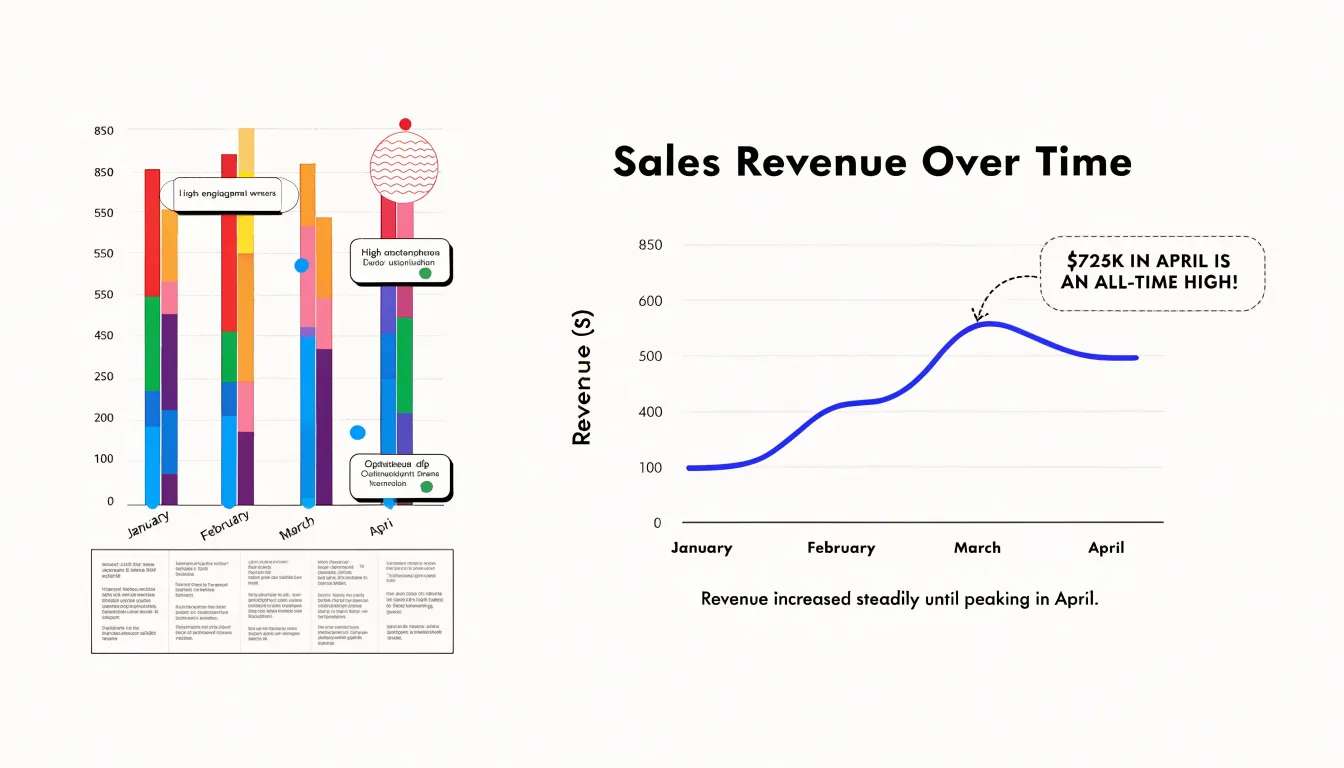
Cole Nussbaumer Knaflic’s Storytelling with Data is the most common entry point. It combines practical chart design guidance with a sustained emphasis on identifying the audience, defining the central message, and choosing visual forms that support it. The book walks through before-and-after examples that show how annotations, decluttered layouts, and deliberate color choices help a viewer follow the argument rather than hunt for it. Readers who want to go further can turn to her follow-up volume, which offers additional case studies and exercises for applying the same principles across real working scenarios.
Nancy Duarte’s work brings a communication lens to the topic. Resonate examines the structure of effective presentations, showing how alternation between what is and what could be creates tension that keeps an audience engaged. Applied to dashboards and slide decks, that pattern helps practitioners move viewers from a problem statement toward a recommended action. For teams preparing executive briefings, these narrative structures translate directly into slide flow and speaker notes.
The books also agree on fundamentals: begin with the audience and the decision at stake, lead with the insight rather than the methodology, and edit ruthlessly so each element earns its place.
Dashboard Design
Dashboard design books address a problem that individual chart-making guides often leave untouched: how to arrange many visual elements into a single, coherent view that a busy reader can absorb in seconds. A well-designed executive dashboard depends on metric hierarchy—the deliberate ranking of information so that the most consequential numbers command attention first. Practical books in this category explain how to sort KPIs into primary, secondary, and supporting tiers, and how to position each tier so the reader’s eye travels naturally from the headline figure to the context behind it. Authors typically walk through grid systems, whitespace allocation, and alignment rules that keep a dense layout from feeling cluttered.
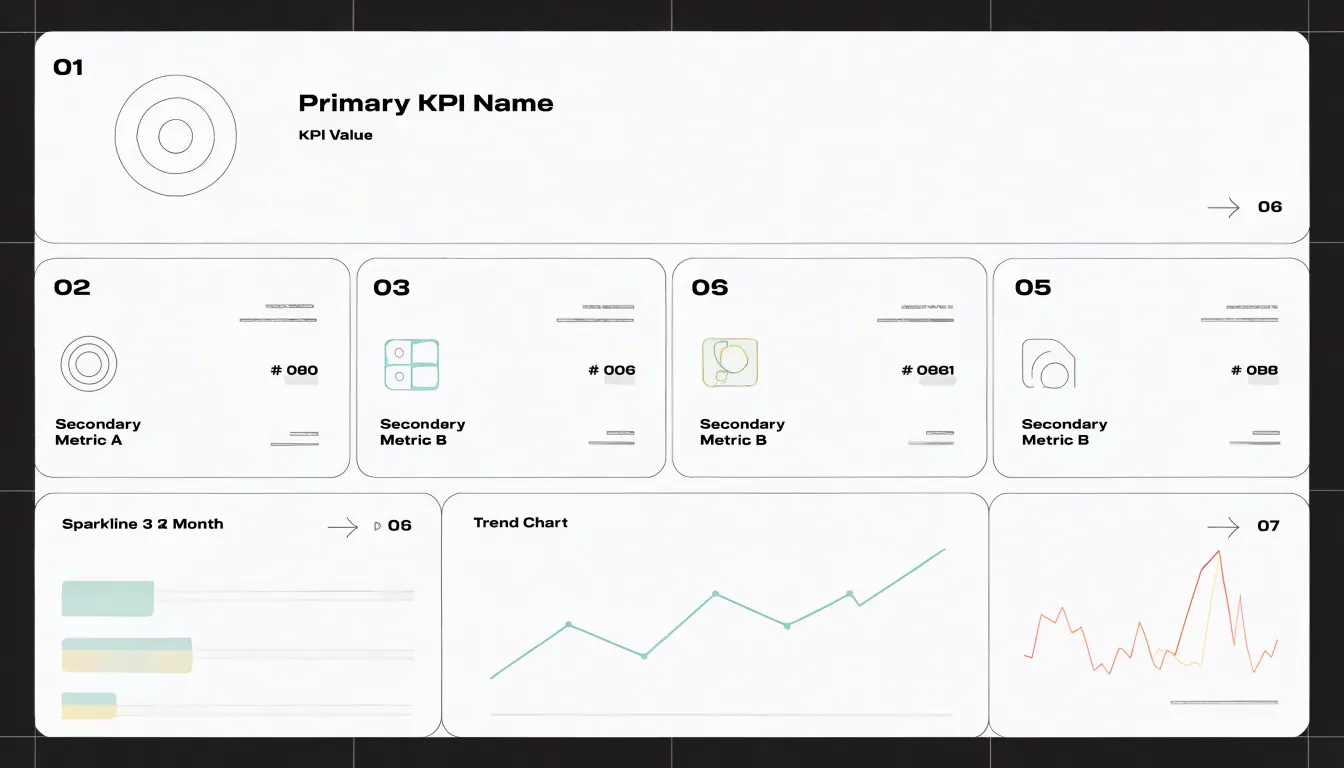
UI and UX best practices form another core theme. These books discuss color usage that signals status without overwhelming, typography that remains legible at a glance, and interactive elements such as filters and drill-downs that let users explore without losing their place. Many titles include before-and-after redesigns, showing a cluttered first draft transformed into a clean final layout.
Layout optimization receives particular attention in the context of executive dashboards, where screen real estate is limited and the audience has little patience for hunting. Books here cover the placement of summary tiles, the sizing of sparklines and gauges, and the sequencing of sections so that the narrative of performance unfolds logically across the page. They also provide templates, checklists, and a vocabulary for critiquing existing dashboards and defending design decisions to stakeholders.
The Functional Art
Alberto Cairo’s The Functional Art treats visualization as a discipline that sits squarely between design and analysis. Cairo, a journalist and educator, built the book around the idea that a good chart must satisfy two audiences at once: the reader who needs to extract information quickly and the analyst who needs the underlying numbers to remain faithful to the data. The book opens with a grounding in human perception and cognition, then moves into practical guidance on form, color, typography, and layout, always tying those choices back to the communicative purpose of the graphic rather than to decoration for its own sake.
What distinguishes The Functional Art from pure design manuals is its insistence on analytical rigor. Cairo devotes substantial space to matching chart types to data structures, to the trade-offs between precision and clarity, and to the ethics of representation, including how poor design can mislead even when the underlying numbers are correct. The book includes extensive interviews with practitioners from journalism, science, and business, giving readers a sense of how these principles play out in real workflows. For beginners, the accessible prose and abundant examples make the material approachable; for practitioners, the deeper treatment of perception research and editorial judgment provides a framework for evaluating their own work.
Truthful Charting
Truthful charting separates visualization as a communication tool from visualization as a persuasion device. Critical guides in this area examine how small design choices can distort a chart’s message, equipping readers to spot and correct problems before a report reaches its audience.
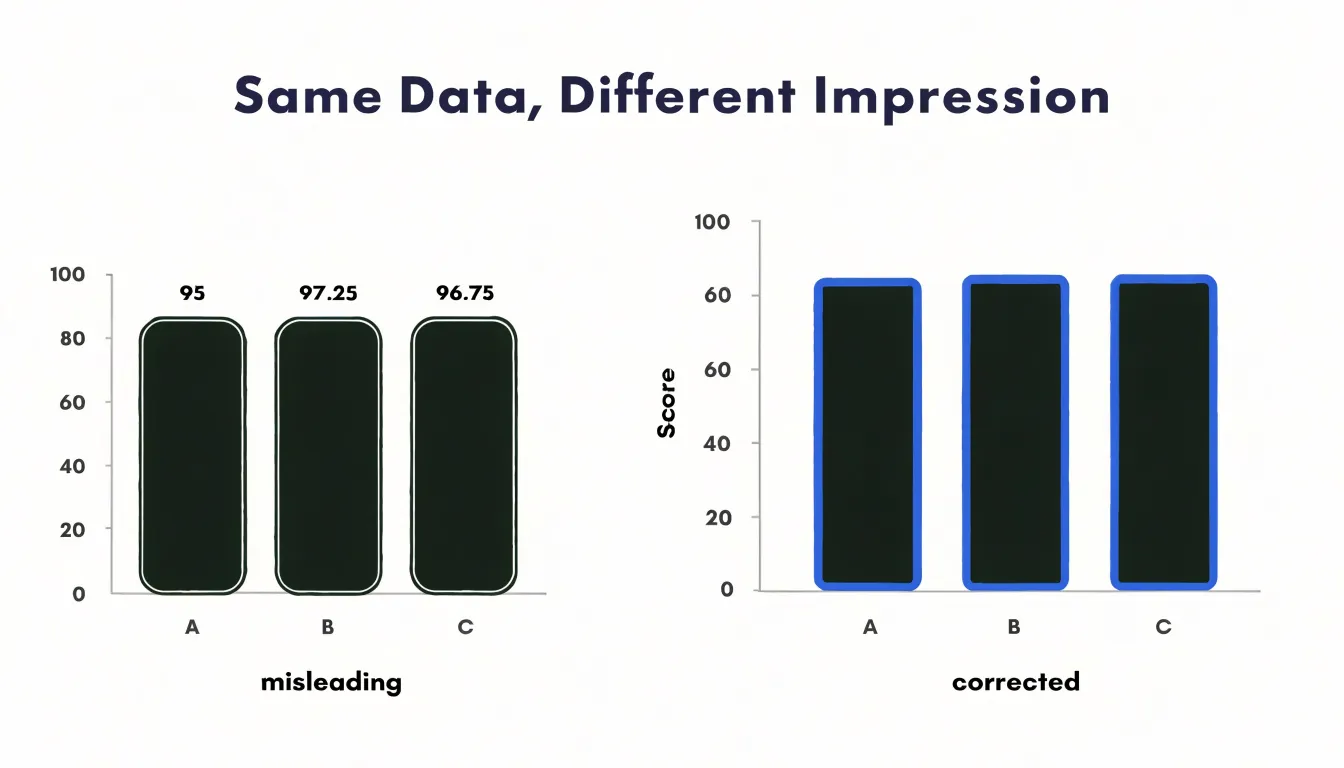
One recurring theme is the truncated axis, where a bar or line chart begins above zero and visually exaggerates differences that are modest in absolute terms. These guides explain why starting at zero matters for bars in particular, walking through examples where honest scaling changes a reader’s conclusion entirely. Beyond axis manipulation, the literature addresses statistical distortion:
- Cherry-picking a favorable time window
- Omitting baseline rates
- Conflating correlation with causation
- Aggregating data in ways that hide variation within groups
- Using dual axes that imply false relationships
- Applying color scales that overstate small differences
Authors often present side-by-side comparisons of misleading and corrected versions of the same chart to make these ethical principles concrete. Many books also discuss the responsibilities of the chart designer within an organization, including how to question a brief that implicitly asks for a flattering graphic, how to annotate uncertainty and data sources transparently, and how to document the decisions behind a visualization so reviewers can audit it. This material builds a habit of asking what a chart leaves out as much as what it shows.
Color Theory
Books on color theory give practitioners a structured way to manage the perceptual and technical consequences of their palette choices. They typically begin with the fundamentals of color harmony: how hue, saturation, and lightness interact, why certain combinations feel balanced, and how palettes built on established relationships—such as analogous, complementary, or triadic schemes—create visual coherence. From there, readers learn to think in terms of perceptual color spaces rather than raw RGB values, understanding how lightness gradients guide the eye and how saturation levels influence perceived importance.
Accessibility receives sustained attention in this literature. Contrast ratio guidance, drawn from standards such as WCAG, shows readers how to test text and graphical elements against backgrounds so that low-vision readers can distinguish every layer of a chart. Discussions of colorblind-friendly palettes address the estimated eight percent of men with some form of color vision deficiency, recommending approaches such as:
- Varying lightness alongside hue
- Adding texture or shape as redundant encoding
- Favoring palettes tested against simulations of deuteranopia, protanopia, and tritanopia
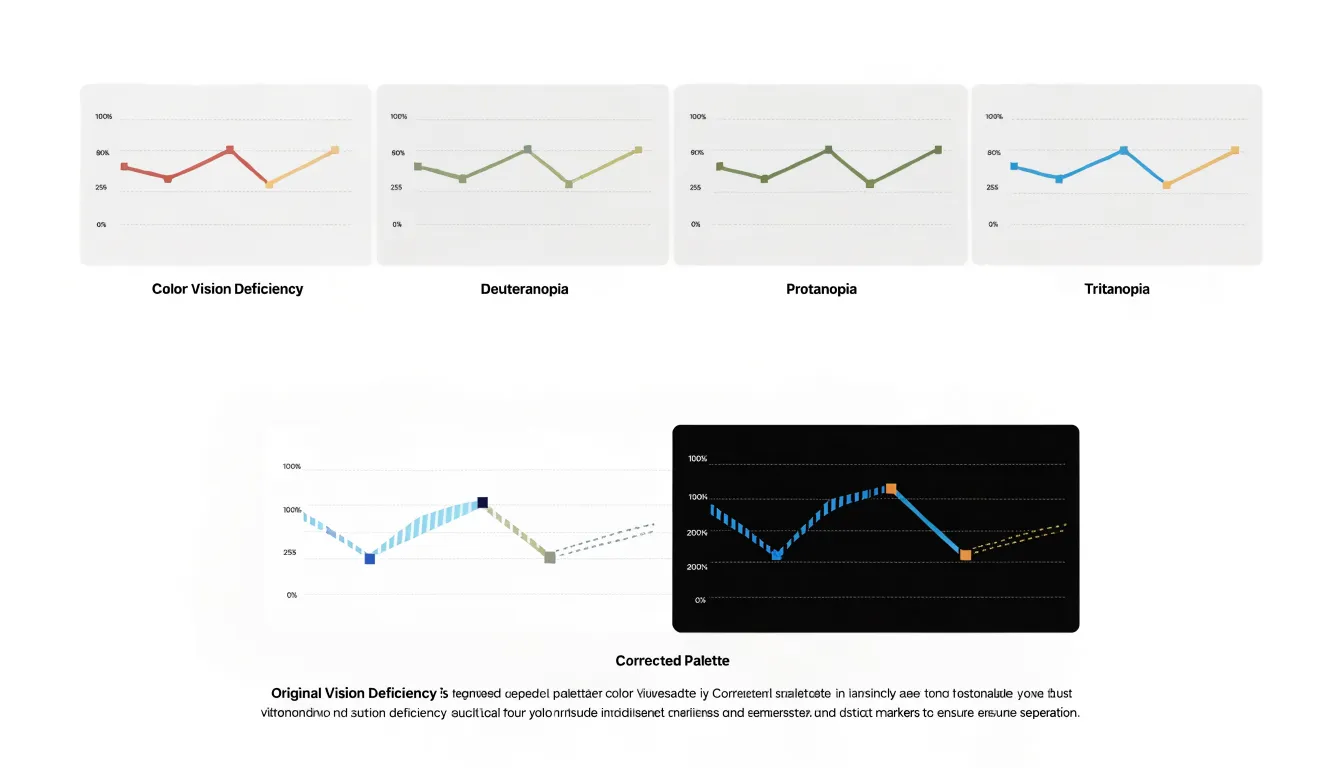
The literature also distinguishes between media. Screen displays render color through additive light and impose their own gamma and calibration quirks, while print relies on subtractive inks with different gamut limits. Books covering both contexts explain how a palette that sings on a monitor may muddy on paper, and how to plan for that transition by testing every palette against real constraints.
Python Visualization
Python has become a default language for analysts who want to move beyond the constraints of spreadsheet charts, and a cluster of well-regarded books helps readers make that transition smoothly. For absolute newcomers, guides built around Matplotlib explain the anatomy of a figure in plain terms: axes, ticks, legends, and subplots are introduced one layer at a time, with short code snippets that can be typed and rerun immediately. Readers learn how to control colors, labels, and layouts deliberately, developing the habit of inspecting documentation and adjusting parameters rather than accepting default outputs.
Seaborn-focused handbooks build on that foundation and show how statistical charting works with tidy data structures. Chapters typically walk through dataset-level functions, categorical plots, regression lines, and faceting, giving readers a vocabulary for small multiples and distribution comparisons. Because these books emphasize the relationship between data shape and chart choice, practitioners finish with a clearer sense of when a violin plot communicates more than a box plot, and how to layer customizations on top of a convenient high-level interface.
For interactive work, Plotly-oriented guides cover hover behavior, zooming, linked views, and dashboards. Readers see how the same figure can travel from a notebook into a web page, and they pick up patterns for handling larger datasets, exporting, theming, and embedding charts in applications. The strongest of these handbooks pair each concept with a complete worked example and a reproducible code repository, giving beginners the muscle memory for building custom charts and practitioners a reference shelf for solving specific styling problems quickly.
R Graphics
For readers working in R, a cluster of textbooks focuses on the grammar of graphics and the practical construction of statistical plots across the three main graphics systems: base graphics, lattice, and ggplot2. The core texts typically begin with base graphics, which offer direct control over plot elements and remain useful for quick exploratory work. Lattice receives attention for its trellis displays, which excel at visualizing multivariate relationships through conditioning and panel functions. The majority of coverage, however, centers on ggplot2, the grammar-of-graphics implementation that has become a standard for reproducible, layered plot construction. These textbooks explain how to map data to aesthetics, choose geoms, and apply scales and facets to reveal structure in complex datasets.
Beyond syntax, these books address the statistical reasoning behind visual layout, such as matching chart types to the underlying model, displaying uncertainty and distributions, and arranging multiple plots for comparison. Scientific publishing receives dedicated treatment, with guidance on setting appropriate dimensions and resolution, selecting print- and colorblind-safe palettes, and labeling axes and legends clearly. Many texts include case studies that walk through the full process from raw data to final figure, serving as practical references for exploratory analysis, reporting, or peer-reviewed publication.
Interactive Web Graphics
Interactive web graphics have become a core skill for data professionals who want their visualizations to respond to user input, update in real time, and live comfortably inside web applications. Building that capability starts with a solid grounding in JavaScript and the browser environment, then moves into dedicated libraries that handle rendering and animation. D3.js remains the most comprehensive resource for this journey. Titles such as Scott Murray’s Interactive Data Visualization for the Web offer a patient, example-driven introduction that walks readers through selections, data joins, scales, axes, and transitions. More advanced guides dive into SVG manipulation, layout algorithms, and custom interactions, giving practitioners the vocabulary to build bespoke graphics from scratch.
Chart.js appeals to readers who need polished, responsive charts quickly. Practical books and courses demonstrate how to configure its chart types, style them to match a brand, wire them to live data sources, and handle updates without redrawing the entire canvas. For teams that prefer a component-based approach, resources covering modern frameworks show how to integrate charting libraries into React, Vue, and Svelte applications, managing state, props, and lifecycle events so visualizations stay in sync with application data. These materials often address performance concerns such as virtualization, debouncing, and efficient DOM updates, which matter when dashboards display many charts at once.
Pairing a foundational D3 book with a framework-specific charting guide and a reference on responsive design gives beginners a clear path, while practitioners can use advanced titles to refine animation, accessibility, and cross-browser reliability in production displays.
Business Intelligence
For analytics professionals working inside larger organizations, business intelligence books move beyond chart design and into the infrastructure that makes visualization reliable at scale. A chart is only as trustworthy as the metric definitions feeding it, so books in this category devote substantial attention to building metric systems that hold together across departments, products, and reporting cycles. Readers encounter frameworks for defining a single source of truth, documenting calculation logic, and maintaining consistency as teams and data sources multiply.
Scalability receives sustained treatment because enterprise analytics teams face volumes and query patterns that small teams never encounter. Authors in this space discuss modeling choices, aggregation strategies, and the tradeoffs between precomputed summaries and live queries, drawing from platform implementations where performance and cost both matter.
Data governance forms another core theme. These guides explain how to establish ownership of datasets, manage access controls, track lineage, and build review processes that keep dashboards accurate over time. Governance is presented as an enabler of self-service analytics, giving business users confidence in the numbers they explore.
Platform integration rounds out the coverage. Business intelligence tools rarely operate alone; they connect to warehouses, transformation pipelines, and embedded analytics environments. The books survey how these pieces fit together, how to choose integration patterns, and how to plan migrations without disrupting reporting, using enterprise case studies to illustrate common pitfalls and proven approaches.
Human Perception
Books that ground data visualization in human perception explore how the brain processes visual information, starting with pre-attentive attributes—features like color, size, orientation, and position that the visual system detects rapidly and without conscious effort. Understanding these attributes helps designers create charts where key patterns pop out immediately, reducing the time viewers spend searching for meaning.
Cognitive load theory further explains why simpler, well-organized visuals are more effective: working memory is limited, so extraneous elements that compete for attention hinder comprehension. By minimizing clutter and structuring information hierarchically, designers can ease the mental effort required to interpret data.
Gestalt principles, such as proximity, similarity, and closure, describe how people naturally group visual elements. Applying these principles guides the eye toward meaningful relationships and away from arbitrary distinctions. Books in this category translate perception research into actionable guidelines, showing how to choose appropriate encodings, arrange elements for clarity, and avoid common pitfalls that lead to misreading.
Spatial Data Mapping
Maps carry conventions and pitfalls that general charting guides rarely cover, from projection choices to the classification of values into bins. The best books in this area combine cartographic theory with practical instruction in GIS software, giving practitioners a foundation they can apply across tools and platforms.
Guides to GIS principles explain how spatial data is structured, how coordinate systems and projections shape what a map can show, and how vector and raster formats differ in their strengths. These fundamentals matter because many mapping errors trace back to decisions made before any styling begins. Choropleth mapping receives sustained attention in this literature, with careful treatment of data classification methods, the influence of geographic unit size on perceived patterns, and the normalization required to make rates comparable across regions of different populations.
Spatial data visual cartography titles go further into design: colorblind-legible schemes, label placement, scale bars, and the balance between detail and clarity at different zoom levels. Many of these books pair their explanations with worked examples using real datasets. While introductory texts provide a gentle entry point to mapmaking, advanced volumes on thematic cartography and geovisualization offer depth on multivariate mapping, uncertainty, and interactive web maps, helping readers recognize when a map is the right form for the data at hand.
Data Preparation
Data preparation is where most visualization projects succeed or stall, and the books in this category cover the full arc of data wrangling: importing messy files, standardizing formats, resolving inconsistencies, and reshaping tables into the tidy structures that visualization tools expect. They walk readers through missing value handling in practical detail, from simple imputation and listwise deletion to flagging strategies that preserve transparency about what was absent and why. Transformation steps receive equal attention, including filtering, aggregation, normalization, type conversion, and the creation of derived fields that make patterns visible once data reaches the plotting stage.
The strongest of these books pair conceptual explanation with reproducible examples using spreadsheets, SQL, R, or Python libraries. Readers learn to audit raw data for duplicates, outliers, and encoding problems, and to document each cleaning decision so that later analysis remains traceable. Several titles devote chapters to joining and merging datasets, handling date and time fields, and dealing with text values that resist easy categorization.
For beginners, the best entry points assume no prior programming background and build confidence through small, cumulative exercises. Practitioner-oriented volumes go further into performance concerns, pipeline automation, and quality validation, which matter when datasets grow beyond what manual inspection can manage. Readers who work through them gain the judgment to recognize when data needs reshaping, when missingness matters, and when a transformation has introduced bias.
Accessible Design
Readings in accessible design cover WCAG compliance, screen-reader compatibility, and inclusive practices that ensure visualizations can be understood by people with a wide range of abilities. Key texts explain how the Web Content Accessibility Guidelines (WCAG) apply to charts and graphs, including requirements for text alternatives, keyboard navigation, and WCAG 2.1 minimum contrast ratios for text and graphical objects. Books such as Accessible Data Visualization by Amy Cesal and Designing Accessible Visualizations by Sarah Horton and Whitney Quesenbery provide practical guidance on meeting these standards without sacrificing clarity, such as using patterns and textures alongside color so information is never conveyed by color alone.
Screen-reader compatibility is another core topic. These resources explain how to write meaningful alt text and descriptions that convey the key insights of a chart to users who cannot see it. They also cover the use of ARIA roles and properties to make interactive visualizations navigable via keyboard and assistive technologies.
Inclusive design practices go beyond technical compliance to consider the diverse contexts in which people access data. Readings address cognitive load, plain language, and customizable layouts, offering strategies to accommodate users with dyslexia, low vision, or limited bandwidth.
Portfolio Projects
Portfolio guides focus on turning finished charts into a body of work that communicates professional competence. Books in this category walk readers through the mechanics of building a public repository on GitHub, a personal website, or a platform like Tableau Public. They explain how to organize project folders, write clear README files, and document the datasets and tools used so that a reviewer can follow the analytical process from raw data to final graphic. The emphasis falls on reproducibility and transparency, since employers and collaborators want to see how decisions were made rather than only the polished output.
A substantial portion of this guidance concerns structuring case studies. Authors typically recommend framing each project around a question, a dataset, a method, and an outcome, with short narrative sections that explain why particular chart types were chosen and what tradeoffs were involved. Readers learn to balance technical detail with readability, presenting code or workflow notes alongside plain-language summaries of findings. Many guides suggest that beginners include a mix of topics and chart types while practitioners demonstrate depth in a domain relevant to their target roles.
Presentation to potential employers receives dedicated attention as well. These books cover how to write concise project summaries, prepare walkthroughs for interviews, tailor a portfolio to specific job postings, and publish work publicly to invite feedback from data communities. Templates for structuring a portfolio site and checklists for reviewing projects round out the practical advice.
Frequently Asked Questions
What should I learn first to build a foundation in data visualization?
Start with the vocabulary of basic chart types, why each exists, and when each communicates most effectively, including bar charts, line charts, scatter plots, histograms, and pie charts. Beginner books also cover chart selection frameworks and foundational visual syntax such as layout, scale, axis treatment, labeling, and annotation.
What does Storytelling with Data teach?
It combines practical chart design guidance with identifying the audience, defining the central message, and choosing visual forms that support it. The book uses before-and-after examples to show how annotations, decluttered layouts, and deliberate color choices help viewers follow the argument.
What do dashboard design books cover?
Dashboard design books cover arranging many visual elements into a coherent view, including metric hierarchy that ranks KPIs into primary, secondary, and supporting tiers. They also address UI and UX best practices, before-and-after redesigns, and layout optimization for executive dashboards.
What distinguishes Alberto Cairo’s The Functional Art?
The Functional Art treats visualization as a discipline between design and analysis, where a good chart must satisfy both a reader who needs quick information and an analyst who needs the underlying numbers to remain faithful. It covers human perception, form, color, typography, layout, analytical rigor, ethics of representation, and interviews with practitioners.
How do truthful charting books address misleading axes?
Truthful charting books examine the truncated axis, where a bar or line chart begins above zero and visually exaggerates differences that are modest in absolute terms. They explain why starting at zero matters for bars and often present side-by-side comparisons of misleading and corrected versions of the same chart.
What do color theory books say about accessibility?
Color theory books include contrast ratio guidance drawn from standards such as WCAG so readers can test text and graphical elements against backgrounds for low-vision readers. They also discuss colorblind-friendly palettes for the estimated eight percent of men with some form of color vision deficiency, including varying lightness alongside hue, adding texture or shape as redundant encoding, and testing palettes against simulations of deuteranopia, protanopia, and tritanopia.
Tony Astor
Tony writes about data visualization and the tools people use to build charts and dashboards. More about Data Illustrator