Best Charts for Survey Data
 By Tony Astor ·

Best Charts for Survey Data
Use vertical bar charts for single-choice categorical survey data, horizontal bars for long labels, stacked bars for demographic breakdowns, and pie or donut charts for part-to-whole views with five or fewer options. Likert data suits diverging stacked bars, continuous scores suit histograms or scatter plots, and repeated waves call for line charts.
Table of Contents
Bar Charts
Vertical bar charts are one of the most dependable tools for presenting survey results built around distinct categories. When a question asks respondents to choose a single option from a fixed list, the resulting counts map naturally onto separate bars, each standing for one response option. Because the bars are anchored to a common baseline and share the same width, readers can compare their heights at a glance and grasp which answers were most and least common without studying a legend or decoding a color scheme.
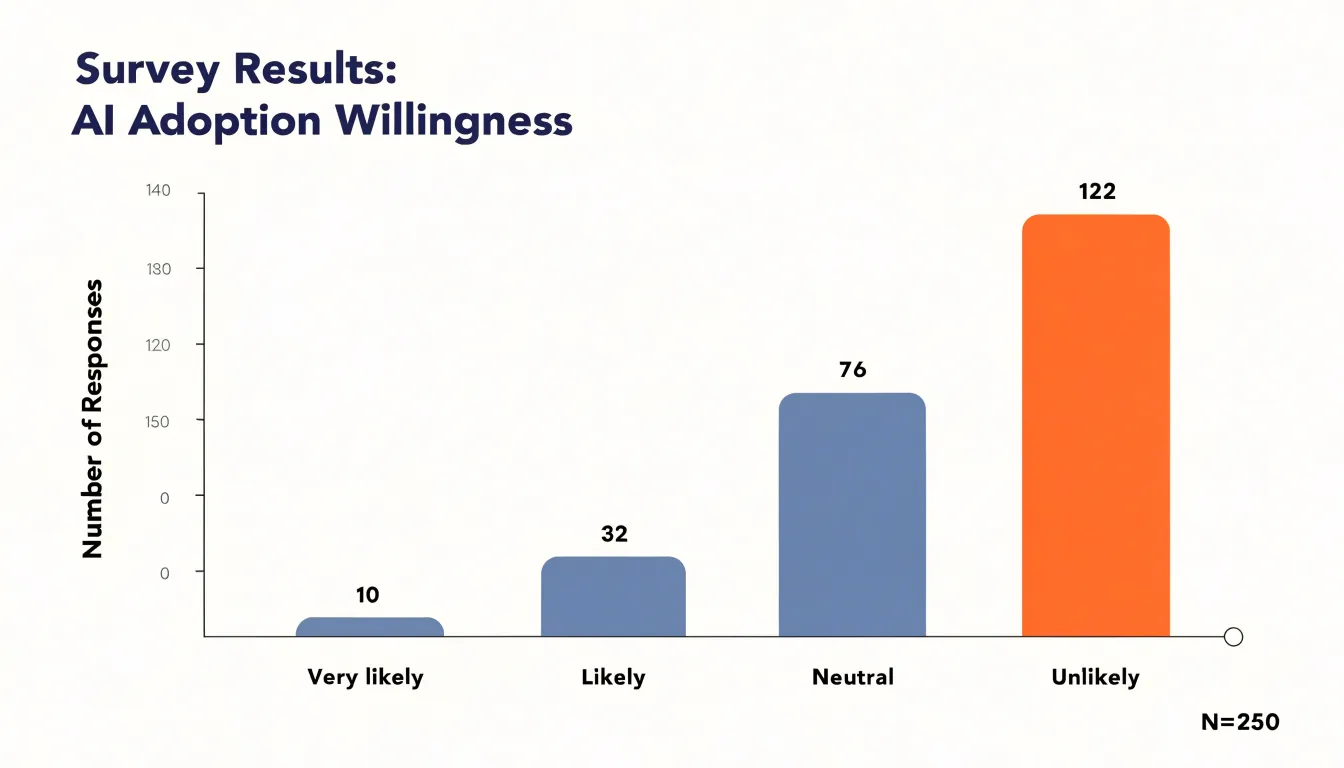
A well-constructed vertical bar chart places category labels along the horizontal axis and response counts or percentages along the vertical axis, so the eye moves easily from label to bar height and back again. This layout works especially well for nominal categories such as age bands, regions, or preferred product features, where categories have no inherent order and each bar stands as a self-contained data point.
Limiting the chart to a single series of bars keeps the visual field clean: there are no overlapping elements, no competing scales, and no need for multiple colors when one consistent fill will do. Sorting the bars by frequency, or arranging them in the logical order of the answer options, reduces cognitive effort and makes patterns—such as a dominant response or a long tail of rare answers—immediately visible. Value labels placed at the top of each bar supply exact figures while the bar lengths carry the comparative message, giving both precision and speed of interpretation for printed reports and on-screen dashboards alike.
Stacked Bar Charts
Stacked bar charts reveal how different demographic groups contribute to overall feedback patterns. When survey responses are broken down by sub-groups such as age, region, or role, a stacked bar chart displays the total for each feedback category while simultaneously showing the proportion each sub-group represents within that total. This dual view shows not just which answer options are most common, but who is driving those results. For instance, if service satisfaction is high overall, a stacked bar chart shows whether that satisfaction is evenly distributed across age groups or concentrated among older respondents.
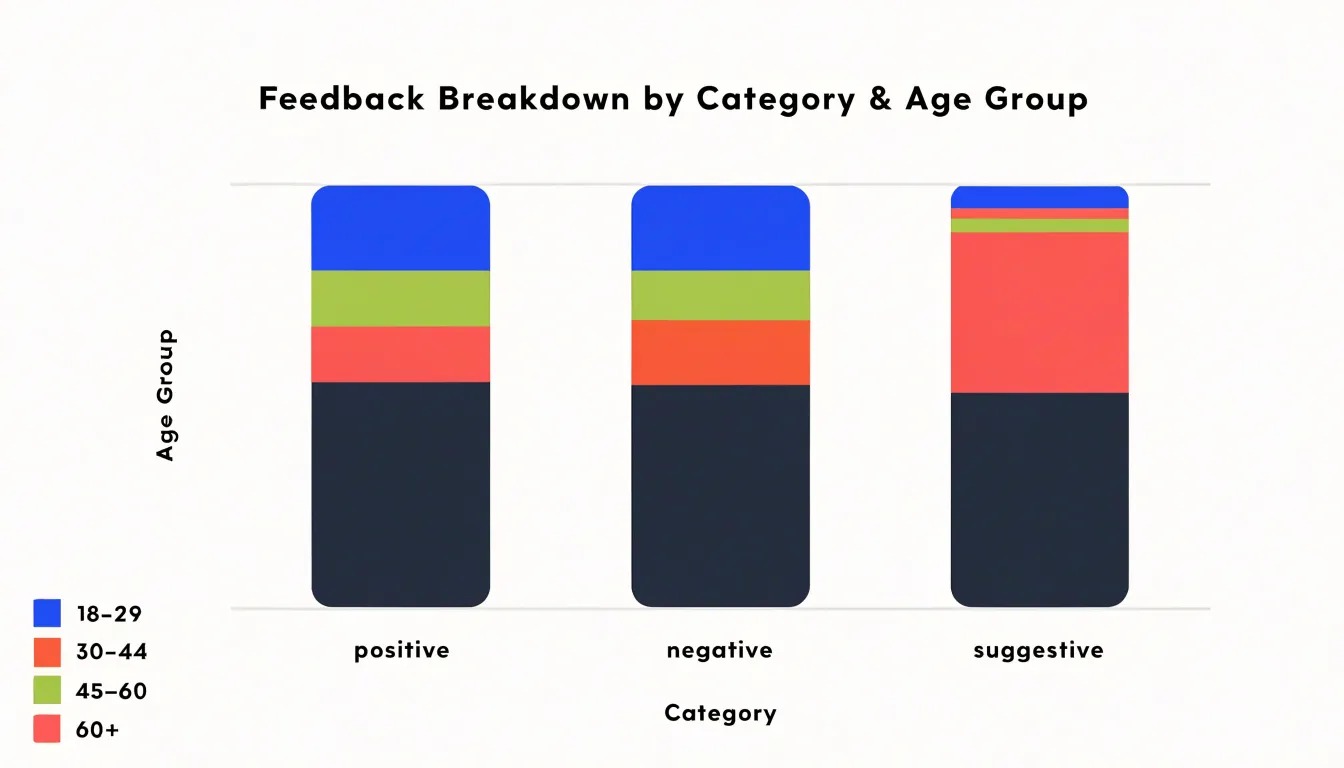
Each bar represents a feedback segment, and the colored segments within it correspond to sub-group proportions, making it easy to compare response composition across different questions or time periods. The visual stacking highlights part-to-whole relationships: you can quickly gauge whether one demographic dominates a particular response category or whether the breakdown is balanced. By scanning across bars, you can identify segments where a specific sub-group is overrepresented or underrepresented, which might signal targeted follow-up questions.
Stacked bar charts work well for categorical survey data with a manageable number of sub-groups, typically up to five or six, to avoid visual clutter. They are particularly useful when communicating demographic breakdowns—such as Net Promoter Scores by customer tier or employee engagement by department—to stakeholders who want both the big picture and the underlying composition.
Horizontal Bar Charts
Horizontal bar charts give survey data room to breathe when the response options carry a lot of words. In a standard vertical column chart, category labels sit beneath the axis, forcing long rating descriptions, detailed answer choices, or full-sentence responses into a narrow band or an awkward angle. Flipping the chart so bars run left to right moves the labels into a vertical column along the left side, where each entry has the full width of the margin and unlimited vertical space to be read naturally, top to bottom.
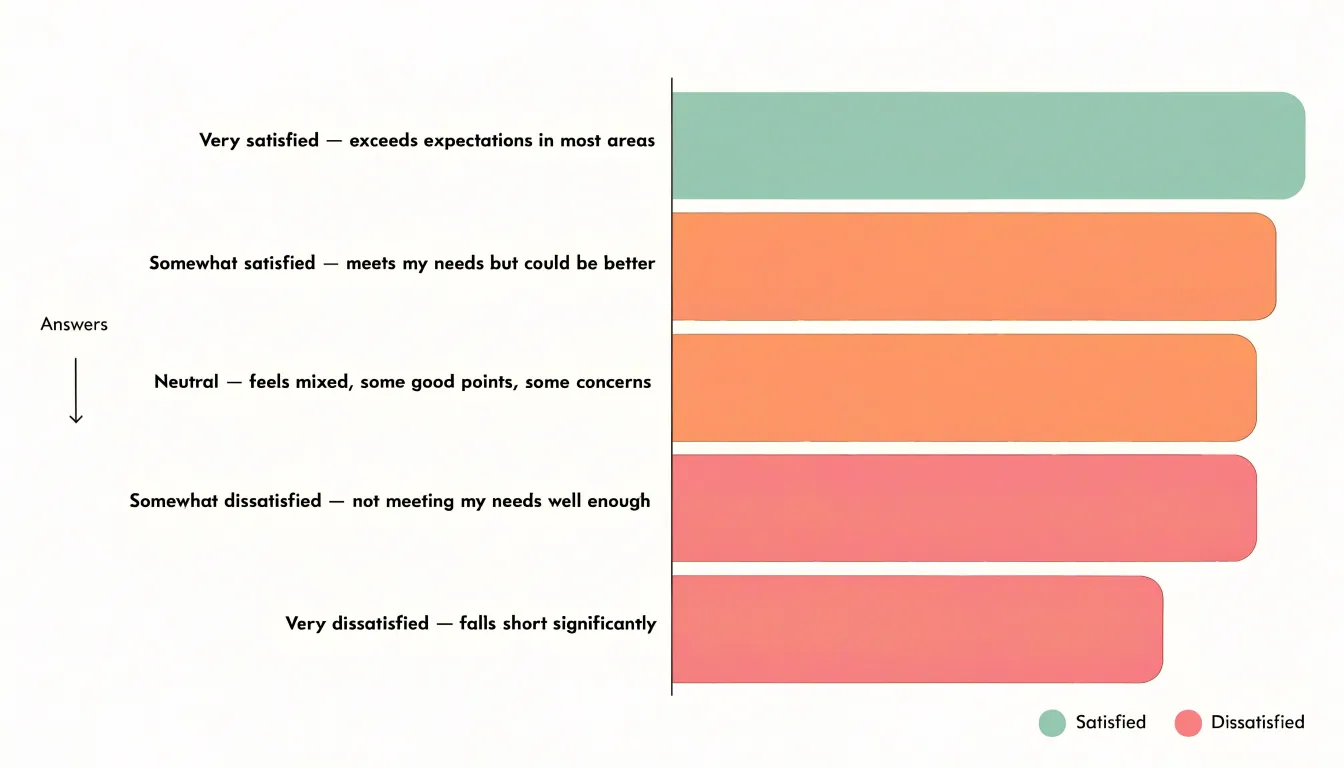
This matters most when survey questions use descriptive scales or phrase-length multiple-choice options, which are common in employee engagement, customer experience, and academic research surveys. A rating label like “Very satisfied — exceeds expectations in most areas” cannot fit comfortably under a vertical bar without truncation or rotation. When response text stretches to eight or ten words, the horizontal format keeps everything legible beside its bar without shrinking the font.
Ordering also becomes more intuitive. A horizontal bar chart sorted by magnitude from largest to smallest reads like a ranked list, with the longest bar at the top and text labels aligned cleanly beside each bar. This arrangement helps readers spot the leading response immediately, while the extra horizontal space accommodates longer axis titles and value labels along the bottom without crowding.
Pie and Donut Charts
Pie and donut charts serve a narrow but useful purpose in survey reporting: showing how a single question divides respondents across a small set of mutually exclusive answer options. A pie chart maps each category to a slice whose angle corresponds to its percentage, while a donut chart presents the same proportions as a ring, leaving room in the center for a total count, an average, or a short summary label. Both forms rely on the intuitive idea that all slices together represent 100 percent of respondents, allowing the reader to compare any slice directly against the full circle.
The format works best when the number of categories stays at five or fewer. With a small set of slices, each segment remains large enough to carry a label and percentage, colors stay distinguishable, and the eye can rank the slices without effort. Simple single-select questions—such as preferred contact method, overall satisfaction level, or age bracket—fit this pattern well when the audience needs a quick part-to-whole overview rather than precise comparisons between small differences.
When preparing these charts:
- Label each slice with its category name and percentage.
- Order the slices consistently, typically from largest to smallest clockwise from the top.
- Use a limited palette that separates adjacent slices clearly.
Likert Scale Charts
Likert scale charts are designed specifically for ordinal data where respondents choose from a range of agreement levels, typically from strongly disagree to strongly agree. Standard charts often flatten these nuanced responses, but specialized visualizations preserve the ordered nature of the scale and the distribution of sentiments across the full spectrum:
- Diverging stacked bar charts center a neutral midpoint and extend bars to the left for disagreement and to the right for agreement, showing the balance of positive and negative sentiment alongside the proportion of neutral responses.
- 100% stacked bar charts display each response category as a percentage of the total, allowing comparison across groups even when sample sizes differ.
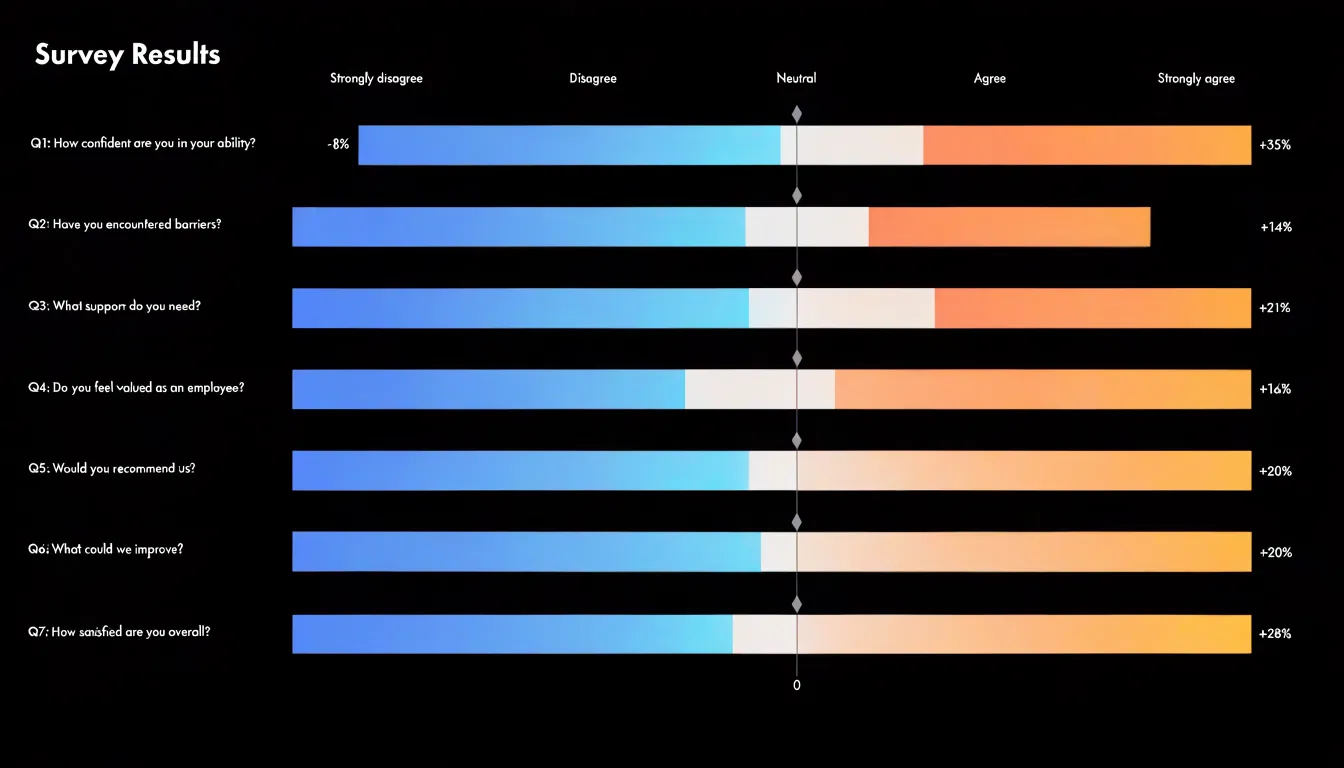
These charts maintain ordinal context by keeping response categories in their natural order, so viewers can trace the gradient from strong disagreement to strong agreement. Using a sequential color palette from cool to warm tones reinforces the scale direction and helps distinguish subtle shifts in opinion. When tracking satisfaction over time, Likert charts can be paired with trend lines or small multiples to show how the distribution evolves. By avoiding the pitfall of treating ordinal responses as simple categorical or interval data, Likert visualizations help stakeholders identify polarization, consensus, or neutral trends.
Diverging Bar Charts
A diverging bar chart arranges responses along a single horizontal axis anchored at a meaningful midpoint, such as “neither agree nor disagree” or “no opinion.” Rather than forcing viewers to mentally tally categories stacked in a conventional bar chart, the diverging layout makes the balance of opinion apparent without arithmetic: a long rightward bar signals strong support, while a long leftward bar signals strong opposition.
Centering the neutral response is the key design decision. When neutral answers sit at the origin, they form a natural dividing line, and the remaining categories spread outward in order of intensity—from mildly to strongly favorable on one side, and mildly to strongly unfavorable on the other. This mirrors how respondents think about agreement scales and prevents a large neutral block from pushing favorable and unfavorable segments into misleading positions.
Survey data often involves a battery of questions measured on the same scale, and diverging bars handle this well. Each question becomes its own row sharing the same centered axis, allowing viewers to scan down the chart and quickly see where an organization is strong and where concerns cluster.
Line and Area Charts
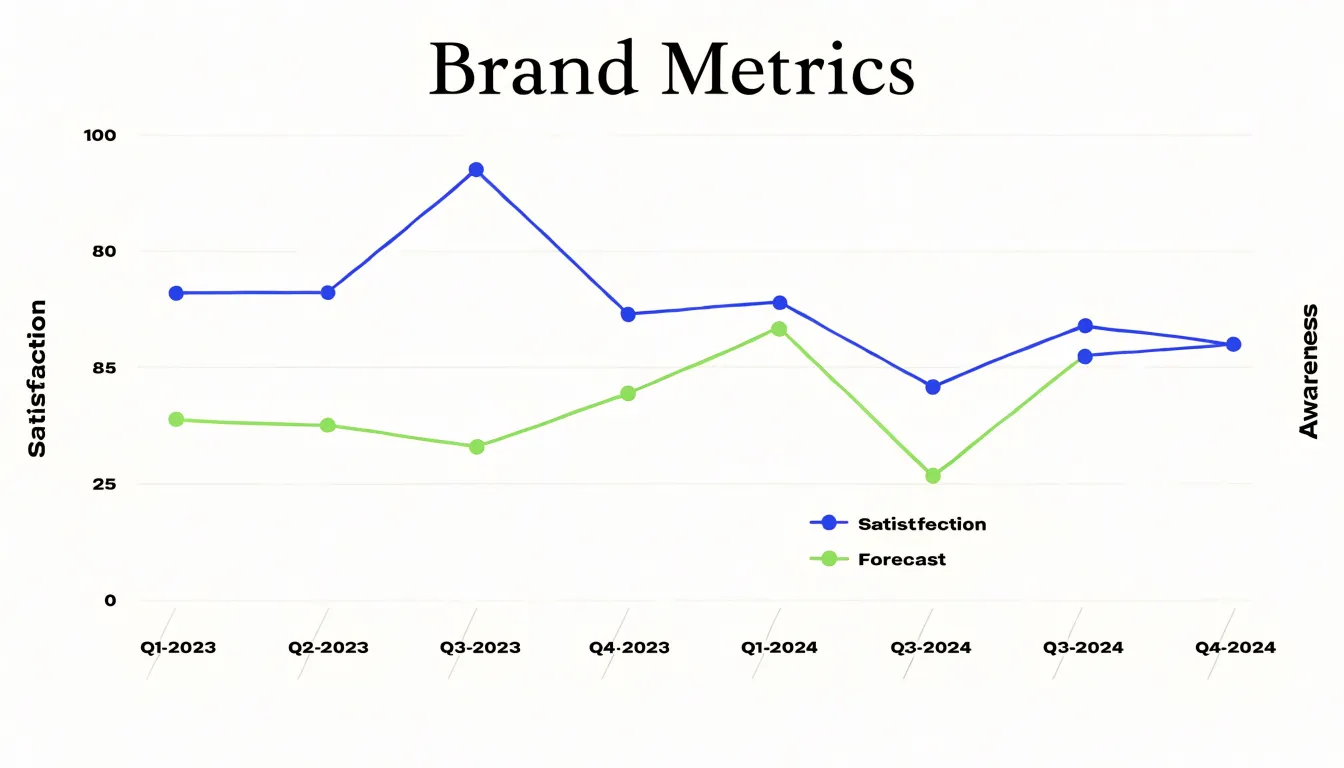
Line and area charts show how survey measures change over continuous time intervals. When a survey runs repeatedly—such as monthly waves or quarterly check-ins—each response set becomes a point along a timeline, and connecting those points turns isolated snapshots into a visible trajectory. Satisfaction, awareness, and preference scores carry momentum: a gradual rise in reported trust over four quarters reads differently from a sharp spike followed by a return to baseline, even when the period average is identical. Area charts extend this logic by filling the space beneath the line, emphasizing the magnitude of the measure or using stacked areas to show how response composition shifts while the overall total stays stable.
Tracking data over two or three years also surfaces seasonal patterns that single-wave reports miss, revealing recurring dips or climbs tied to calendar events, budget cycles, or product launches. These rhythms inform when to field new waves and how to interpret apparent changes. Alongside seasonality, repeated measurement captures the signature of a feature rollout, a pricing change, or a public incident. The key requirement is consistent intervals and consistent question wording, since irregular spacing or reworded items introduce artifacts that look like real movement.
Heat Maps
Heat maps translate cross-tabulated survey response matrices into color-coded grids where each cell’s hue or intensity reflects the concentration of answers, ratings, or respondents at that intersection. Where a raw table of numbers can bury patterns beneath rows of similar-looking figures, mapping values to a color scale lets viewers scan the entire grid at once to spot high- or low-density clusters. A marketing team comparing satisfaction ratings across age groups and product lines, for example, can immediately see which demographic segments cluster around positive or negative responses, then drill into those cells for detail.
Heat maps also handle dense rating matrices where hundreds of respondents rate dozens of features, attributes, or statements. Darker or warmer cells signal concentrated agreement, while lighter or cooler cells reveal where responses spread thin or skew negative. Analysts can follow horizontal bands to compare items and vertical bands to compare respondent segments.
For readability, match the palette to the scale: a sequential palette suits single-direction scales like frequency counts, while a diverging palette centered on a neutral midpoint suits rating scales. Clear legends, sensible binning, and row and column labels keep the grid interpretable.
Scatter Plots
Scatter plots explore the relationship between two numerical survey questions by plotting each respondent’s paired answers as a single point on a two-dimensional graph, with one question per axis. For instance, if a survey asks for user satisfaction on a scale of 1 to 10 and weekly product usage in hours, a scatter plot shows how each individual scored on both dimensions simultaneously:
- Direction: Points clustering along an upward diagonal indicate a positive correlation (higher usage coincides with higher satisfaction). A downward slope suggests a negative relationship, while randomly scattered points imply little to no association.
- Strength: Tight clusters suggest a strong correlation; widely dispersed points indicate a weaker one.
- Outliers: Points that deviate markedly from the general pattern—such as a user with very high usage but very low satisfaction—expose specific pain points worth investigating.
When interpreting scatter plots, remember that correlation does not imply causation; a visible relationship simply means the two variables move together. Still, scatter plots provide an intuitive first look at how two numerical responses interact, guiding deeper statistical analysis or follow-up questions.
Radar Charts
Radar charts, or spider plots, compare multiple quantitative survey metrics side by side. Each dimension is assigned an axis radiating outward from a common center like the spokes of a wheel. A respondent’s or group’s score is plotted along each spoke, and the points are connected to form a closed polygon, summarizing performance across all dimensions at once.
A central benchmark—representing an organizational average, a target score, or a prior survey wave—anchors the comparison as a reference polygon. Where a plotted shape extends beyond the benchmark, performance exceeds the reference; where it pulls inward toward the center, the dimension lags. Because all axes share a common scale and origin, the relative distance from the center conveys meaning directly.
The format works best with five to eight dimensions, keeping each spoke legible and the polygon contour recognizable. Overlaying a few translucent polygons makes divergences and overlaps across segments easy to spot—whether a marketing team is plotting brand perception across awareness, trust, and value, or an HR group is charting engagement across recognition, workload, and growth.
Histograms
Histograms show how often continuous numeric survey responses—such as satisfaction ratings, likelihood-to-recommend scores, or agreement scales—fall within set ranges. To create one, divide the full span of possible responses into consecutive score ranges (bins) and count how many respondents land in each range. The resulting bars sit side by side with no gaps, with bar height reflecting frequency.
Because the bars represent intervals rather than discrete categories, the overall shape of the distribution reveals far more than a simple average:
- Skewness: A tall cluster at one end with a long, thinning tail toward the other shows whether respondents concentrate near the low or high end of the scale.
- Symmetry vs. polarization: A pronounced central peak tapering evenly on both sides indicates a balanced distribution, while two separate clusters signal a polarized audience with little middle ground.
- Outliers: Isolated bars far from the main body of responses prompt a closer look at whether those answers reflect a real segment or a data quality issue.
Bin width matters considerably. Fewer, wider ranges produce a smooth, simplified picture, whereas narrower ranges surface finer detail and subtle irregularities that broader bins hide.
Word Clouds
Open-ended survey questions produce rich qualitative material, but the volume of free-text comments is difficult to summarize. A word cloud brings that material into view by breaking raw comments into individual terms, removing common stop words (such as articles and prepositions) and low-meaning terms, and counting how often each remaining word appears. Visual prominence reflects frequency: the more often a word appears, the larger it is rendered.
When many participants mention words like “waiting,” “staff,” or “appointment,” those terms stand out immediately, pointing toward shared concerns. This makes word clouds an efficient opening visual in presentations and reports to orient an audience before detailed analysis.
Building a word cloud also serves as a useful first pass during research. Reviewing the vocabulary surfaces recurring language across dozens of comments, which can then guide deeper coding and theme development based on genuine repetition rather than analyst assumptions.
Common Chart Pitfalls
Small design decisions can quietly distort survey findings:
- Truncated axes: Starting a bar chart’s y-axis above zero makes modest differences look dramatic. In survey reporting, where a five-point gap between two answer categories may be the entire finding, a truncated baseline can inflate a minor preference into an apparent landslide.
- Misleading scale increments: Uneven intervals, unlabeled logarithmic axes, or grids that jump in large steps prevent proportional comparisons across options.
- Poor color choices: A rainbow palette obscures the natural progression of ordered Likert responses, while similar hues on adjacent categories make them blend together. Red-green combinations create problems for readers with color vision deficiencies, and high-saturation colors on minor categories draw attention away from the primary result.
- Clutter and missing context: Crowded labels, missing sample sizes, and pie charts sliced into too many segments erode clarity.
To avoid these pitfalls, begin bar chart axes at zero, use consistent and clearly labeled increments, choose palettes that reflect the data’s structure, reserve the strongest visual weight for the most important data points, and include sample sizes.
Final Chart Selection
Selecting the right chart starts with the question type and the data it produces:
- Single-choice categorical (nominal): Vertical bar charts or pie/donut charts (for five or fewer options).
- Ordered categories or long text labels: Horizontal bar charts to preserve ranking and readability.
- Multiple-selection questions: Bar charts sorted by frequency or dot plots, which show relative popularity without implying mutual exclusivity.
- Demographic breakdowns of categories: Stacked bar charts (for up to five or six sub-groups).
- Ordinal rating scales (e.g., 1 to 5): Diverging stacked bars or 100% stacked bars for sentiment balance; heat maps for dense cross-tabulated rating matrices.
- Continuous numeric scores: Histograms for single-variable distributions; scatter plots for relationships between two numeric variables; grouped bar charts or box plots for comparing groups across a rating; radar charts for comparing five to eight metrics against a benchmark; line or area charts for tracking waves over time.
- Open-ended text: Word clouds for a quick initial impression (though they lack precision), or bar charts of coded theme frequencies.
To narrow the choice further, follow a three-step decision framework:
- Identify whether the data is categorical, ordinal, numeric, or text.
- Determine whether the analytical goal is comparison, composition, distribution, or relationship.
- Match the chart’s complexity to the audience—using simple bar or pie charts for executive summaries, and detailed Likert scales, box plots, or heat maps for analytical stakeholders.
Frequently Asked Questions
What type of chart is best for single-choice survey questions?
For single-choice categorical questions with a fixed list of options, vertical bar charts are a dependable choice. Pie or donut charts can also show how respondents divide across a small set of mutually exclusive options, but they work best when there are five or fewer categories.
How do I display survey answer choices that contain a lot of words?
Use a horizontal bar chart when response options carry a lot of words. It moves labels into a vertical column along the left side so they can be read naturally, and sorting by magnitude makes the chart read like a ranked list.
How can I show survey results broken down by demographic groups?
Use a stacked bar chart to display the total for each feedback category while also showing the proportion each sub-group represents within that total. Stacked bar charts work well with a manageable number of sub-groups, typically up to five or six.
What chart should I use for Likert scale survey data?
For Likert scale data, use specialized charts such as diverging stacked bar charts, which center a neutral midpoint and extend left for disagreement and right for agreement. A 100% stacked bar chart can also show each response category as a percentage of the total for comparison across groups.
How do I visualize survey data collected over time?
Use line or area charts to show how survey measures change over continuous time intervals, such as monthly waves or quarterly check-ins. The article notes that the key requirement is consistent intervals and consistent question wording.
What is a common chart mistake to avoid in survey reporting?
Avoid truncated axes: starting a bar chart’s y-axis above zero makes modest differences look dramatic and can inflate a minor preference into an apparent landslide. To avoid this, begin bar chart axes at zero and use consistent, clearly labeled increments.
Tony Astor
Tony writes about data visualization and the tools people use to build charts and dashboards. More about Data Illustrator