Best Charts for Project Management
 By Tony Astor ·

Best Charts for Project Management
The best charts for project management include Gantt charts for scheduling and task dependencies, Kanban boards for visualizing workflow and limiting work in progress, PERT charts for estimating uncertain durations, Critical Path Method diagrams for identifying deadline-driving tasks, and RACI matrices for clarifying roles. Others include burndown and burnup charts, WBS, Pareto charts, flowcharts, and fishbone diagrams.
Table of Contents
Gantt Chart
A Gantt chart maps a project schedule along a horizontal timeline. Each task appears as a bar whose length corresponds to its duration, showing start and end dates at a glance. This format lets project managers grasp the overall timeline and spot potential bottlenecks.
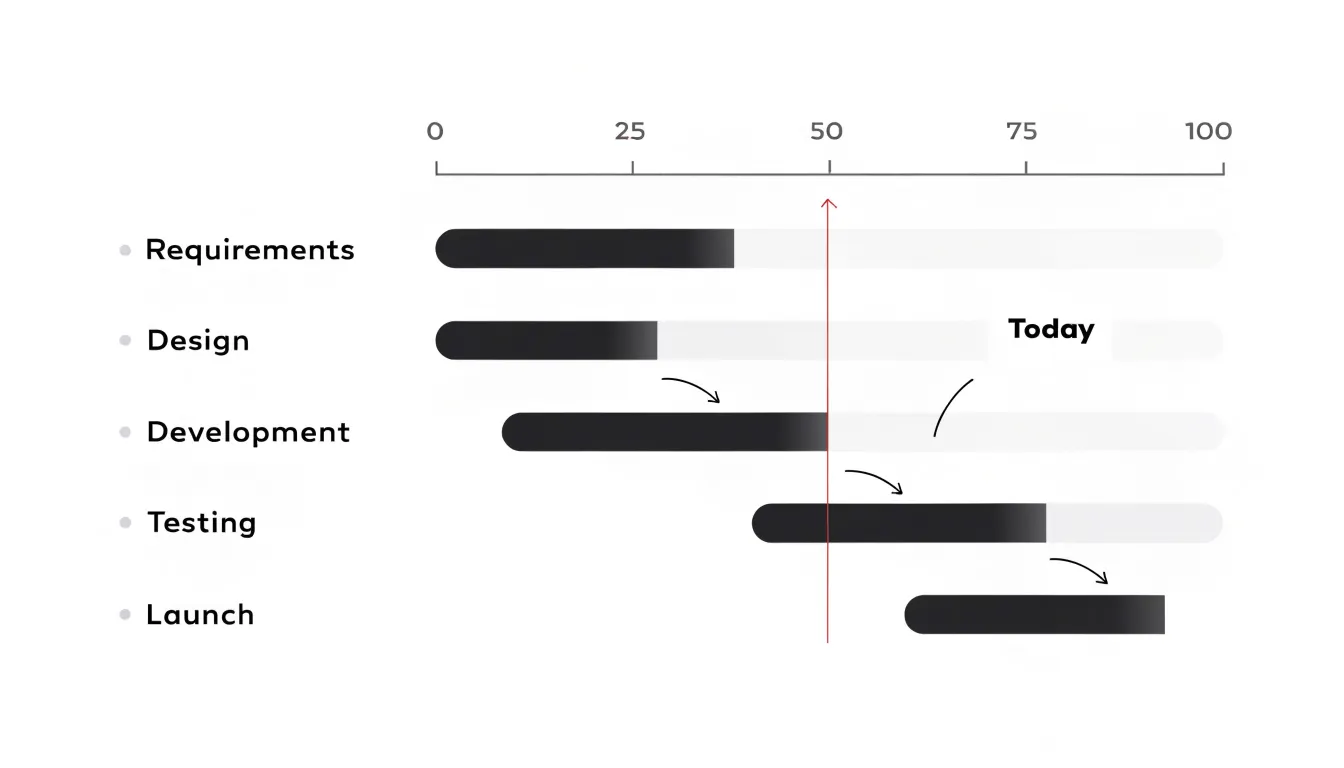
A key strength of a Gantt chart is illustrating task dependencies. Arrows or lines connect the bars to show which tasks must finish before others can begin—for example, making it explicit that testing cannot start until development is complete. Seeing the sequence of work helps managers avoid delays from overlooked dependencies and allocate resources effectively.
Gantt charts also support progress tracking by comparing the planned schedule with actual progress. If a task falls behind, the manager can reassess dependencies, reschedule subsequent tasks, and dynamically update the chart. Finally, the chart gives stakeholders and team members a clear overview of responsibilities and deadlines, fostering accountability across the project.
Kanban Board
A Kanban board shows how work moves from idea to completion. Columns represent workflow stages—such as Backlog, In Progress, Review, and Done—and individual tasks appear as cards that travel from left to right. Making the state of every task visible shows where work is piling up and where capacity is available, leading to shorter status meetings and fewer dropped tasks.
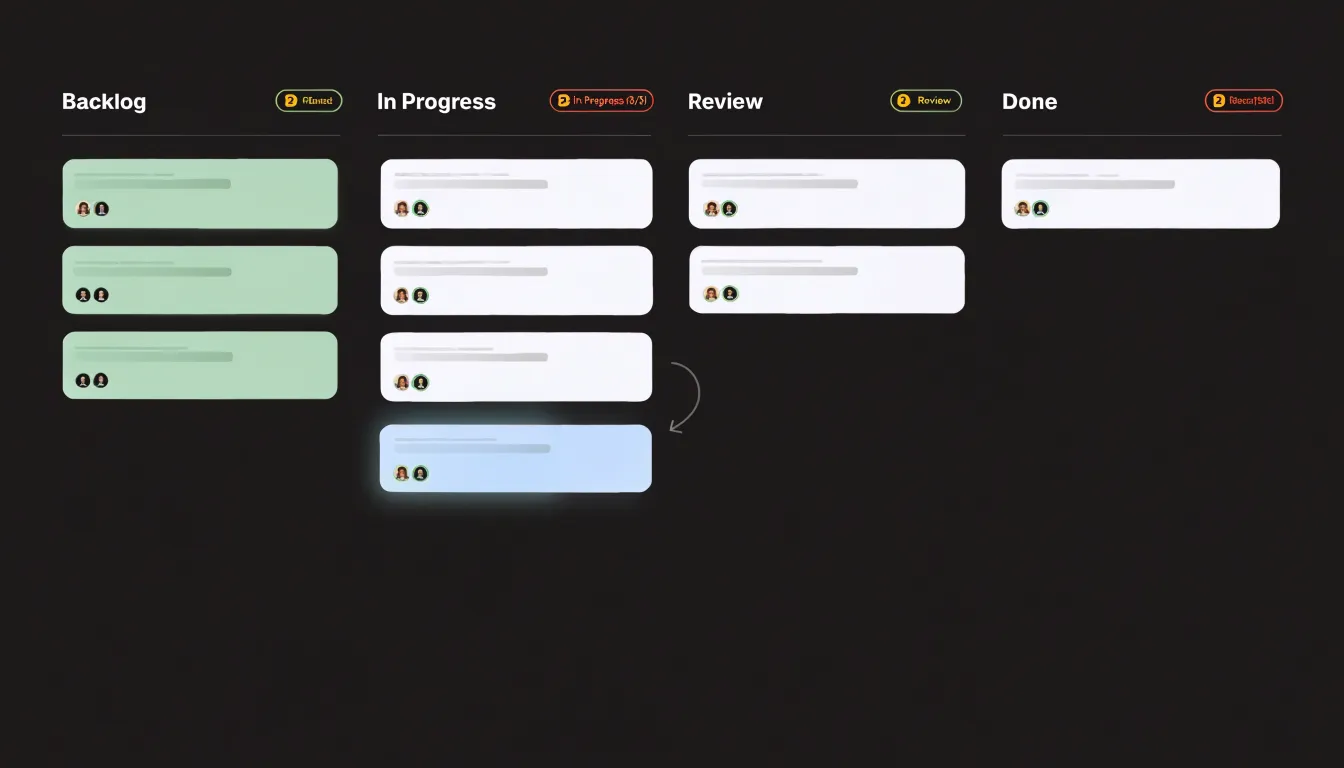
Kanban’s most distinctive feature is the work-in-progress (WIP) limit: a maximum number of cards allowed in active columns like In Progress or Review. Once a column reaches its cap, no new work can enter until an existing card moves forward. This constraint forces the team to finish started work before taking on more, concentrating effort on clearing bottlenecks rather than multitasking.
WIP limits also protect the team from overload by providing a structural reason to decline new commitments until capacity frees up. Over time, the board makes cycle time—the average duration a card spends in the workflow—measurable, helping teams spot recurring bottlenecks and adjust their stages or limits to improve throughput.
PERT Chart
Program Evaluation and Review Technique (PERT) charts help project managers estimate timelines when task durations are genuinely uncertain. The chart maps every task as a node or arrow within a dependency network to show the sequence of work from start to finish.
Instead of assigning each task a single fixed duration, PERT uses three-point estimates:
- Optimistic time: assuming everything goes smoothly.
- Pessimistic time: assuming complications arise.
- Most likely time: reflecting everyday expectations.
These three values combine into a weighted average—commonly calculated as (optimistic + 4 × most likely + pessimistic) ÷ 6—which weights the most likely estimate heavily while accounting for extremes. Summing these expected durations along the chart’s dependency paths reveals the overall project duration, with the longest path identified as the critical path.
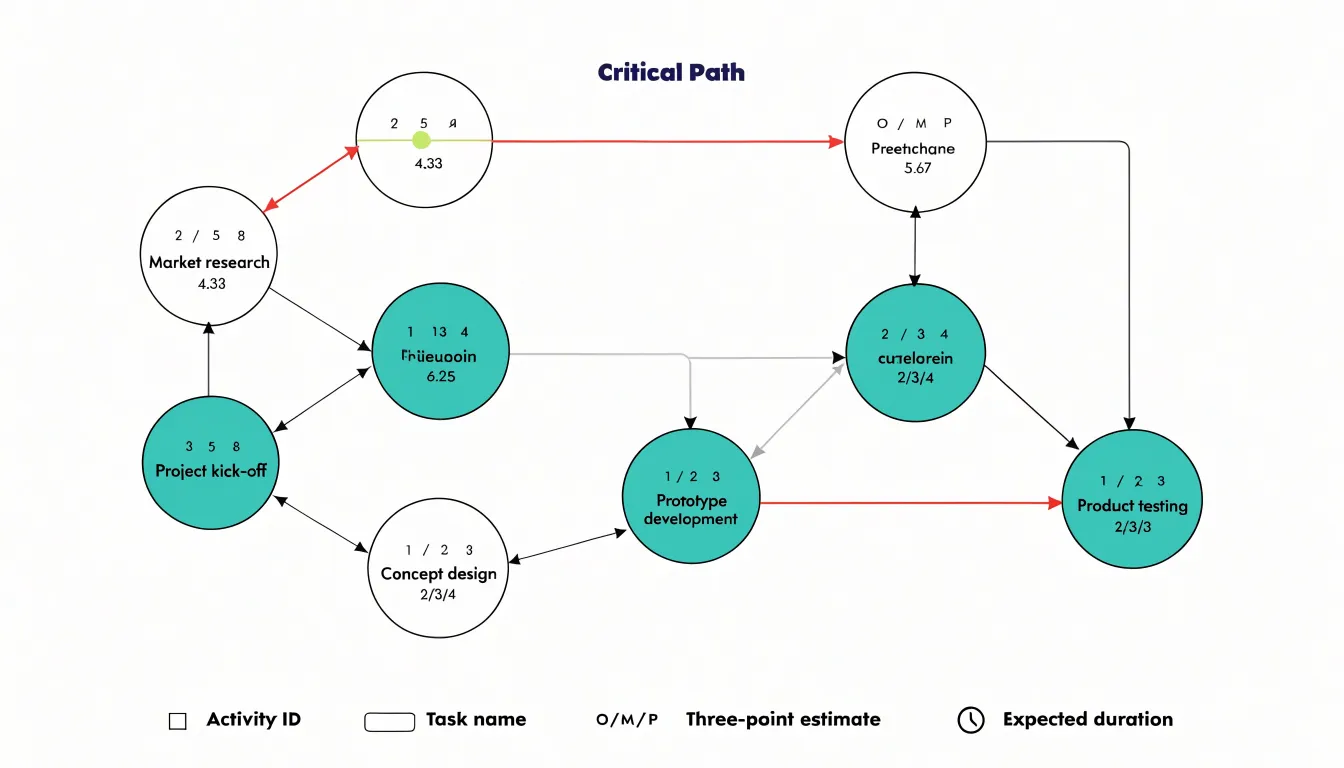
For complex initiatives, research and development, or unfamiliar work, PERT provides a defensible forecast grounded in acknowledged uncertainty. The gap between optimistic and pessimistic figures also signals how much variability a task carries, helping teams plan contingency for high-risk activities.
Critical Path Method
The Critical Path Method (CPM) identifies the tasks that determine whether a project will meet its deadline. After breaking the project into tasks and mapping their dependencies, the longest sequence of dependent tasks stands out as the critical path. Because this chain has no slack (or float), its total duration sets the minimum timeline for the project. Any delay on a critical task pushes the final delivery date back by the same amount, whereas delays on non-critical tasks can be absorbed by their available float.
Isolating this path reveals where the schedule is most fragile. Because a missed handoff, underestimated effort, or late approval on the critical path ripples straight to the deadline, managers can focus extra scrutiny, buffers, and experienced staff on these high-risk items rather than spreading attention evenly.
During execution, CPM clarifies how to respond to delays. If a critical task slips, the team knows to add resources or resequence work immediately; if a non-critical task slips, its float shows how much room remains before it becomes a threat. Network diagrams or Gantt charts with highlighted critical tasks make these priorities visible at a glance.
RACI Matrix
A RACI matrix is a grid that maps tasks, deliverables, or decisions along one axis and team members along the other, assigning specific roles using four labels:
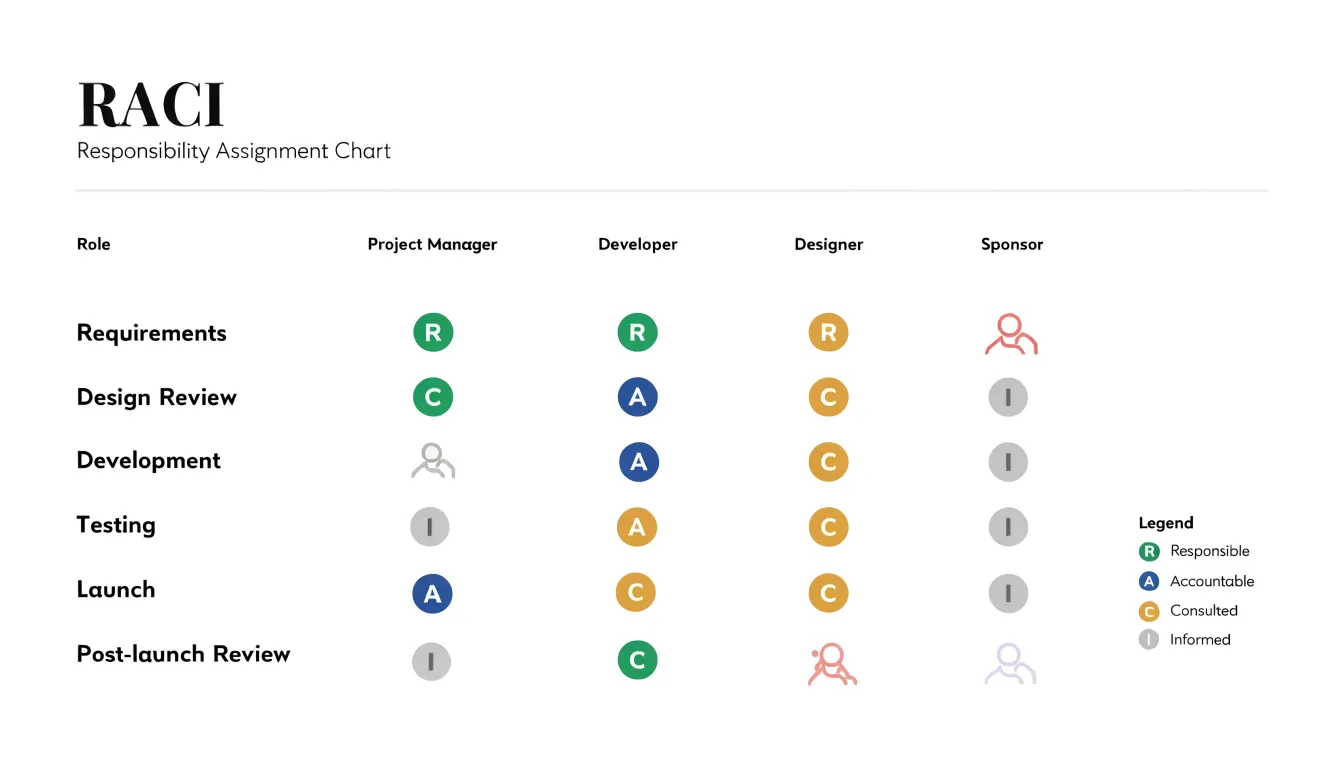
- Responsible: The people who perform the work and produce the output.
- Accountable: The single individual who owns the outcome and answers for its success or failure.
- Consulted: Subject-matter experts whose input shapes the work before completion.
- Informed: Stakeholders who need visibility into progress or decisions but do not execute the work.
The primary benefit is preventing task overlap and gaps during planning. Each row shows whether responsibilities are distributed sensibly, preventing two people from inadvertently starting the same deliverable or a step falling through the cracks because everyone assumed someone else had it.
Designating exactly one Accountable person per task also keeps decisions from stalling and gives escalations an obvious destination. This role clarity reduces friction in cross-functional projects where departments hold different assumptions about ownership, and the matrix can be updated as responsibilities shift across project phases.
Burndown Chart
A burndown chart plots the work remaining in a sprint (on the vertical axis, measured in story points, hours, or task counts) against time (on the horizontal axis). The line starts high at the beginning of a sprint and slopes downward as the team updates it daily, giving Agile teams real-time visibility into their sprint velocity. A steep drop indicates strong momentum; a flattening line signals stalled progress.
Teams usually draw a straight diagonal “ideal burndown line” from the starting workload to zero at the sprint’s end. If the actual line tracks above the ideal line, the team is behind schedule and may need to adjust scope or clear blockers; if it falls below, they are ahead. Projecting the current trajectory forward helps Scrum masters and product owners predict whether work will reach zero on time and decide during daily standups or sprint reviews whether to reprioritize. Across multiple sprints, burndown patterns also reveal systemic issues like consistent overcommitment or underestimation.
Burnup Chart
A burnup chart tracks two lines over time: total project scope and completed work. As the completed-work line rises toward the scope line, teams can measure progress in absolute terms, while flat sections on the completed line highlight plateaus where blockers slowed delivery.
The burnup chart’s distinct advantage appears when requirements shift. Any upward step in the scope line records added work from new requirements or stakeholder requests, making scope creep an observable trend rather than a vague impression. Separating scope from completion lets teams pinpoint when scope grew and connect it to the decision that caused it. Stakeholders can see directly how an added feature pushes out the completion date or requires more resources, grounding status meetings in shared data.
Work Breakdown Structure
A Work Breakdown Structure (WBS) decomposes a large project goal into progressively smaller pieces. Starting with the final deliverable at the top, it breaks components down through successive levels into work packages that can be realistically estimated, assigned, and tracked. This hierarchy shows every team member how their tasks connect to the overall objective.
Granular work packages allow for much more accurate cost and resource estimation than guessing at a lump sum for an entire phase. Estimators can price each element and roll the figures up into a reliable total budget, while managers can see the exact skills and hours required for each package.
A WBS also guards against missed scope. Guided by the 100 percent rule—which states that the sum of child elements must fully represent the parent—stakeholders can review the branches as a checklist of required outputs and spot overlooked deliverables before work begins. Maintained throughout the project, the WBS serves as a baseline for scope control and change evaluation.
Pareto Chart
A Pareto chart combines a bar chart ranking categories in descending order of frequency or impact with a line showing cumulative percentage. It visualizes the 80/20 rule, where a small number of categories typically account for most of the total effect.
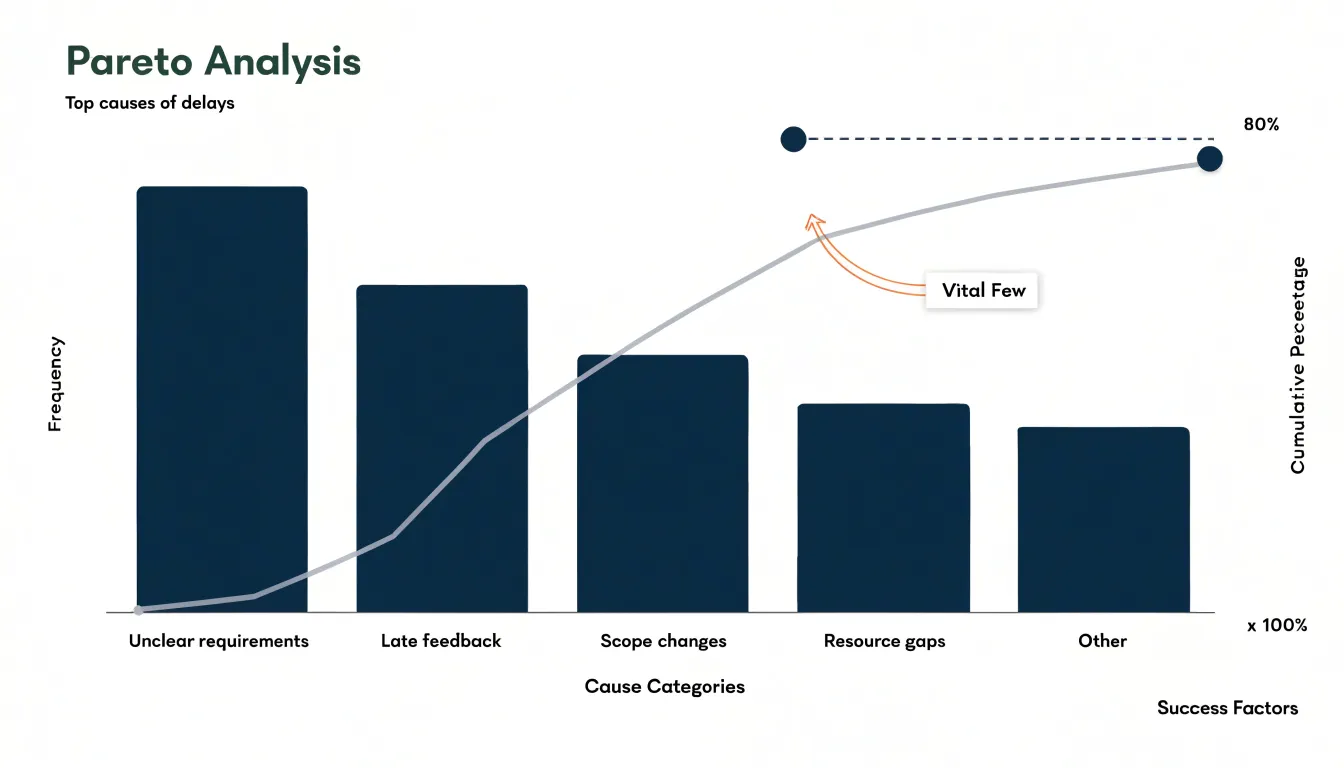
In project management, logging delays, defects, or budget overruns in a Pareto chart quickly separates the “vital few” causes from the “trivial many.” For example, it might reveal that 20% of delay causes—such as unclear requirements or late client feedback—drive 80% of lost days. Teams can then prioritize corrective actions that yield the greatest improvement, while using the cumulative line to show stakeholders exactly how much of the problem each fix will resolve.
Flowchart
A flowchart maps a process from start to finish using standardized symbols: ovals for start and end points, rectangles for tasks or steps, diamonds for decision branches, and arrows for flow direction. This shared visual grammar lets team members trace requests, approvals, or deliverables without reading lengthy procedures.
Documenting workflows in flowcharts standardizes processes across teams, clarifying handoffs and approval steps. Laying a process out visually also exposes redundancies, unnecessary steps, and decision loops that cause delays, allowing teams to streamline the workflow before implementation. Beyond process design, flowcharts serve as accessible training tools for new team members and living documents that can be updated as processes evolve.
Fishbone Diagram
When a project suffers a missed deadline, quality drop, or spike in rework, the fishbone (or Ishikawa) diagram helps teams unpack the underlying causes. The diagram’s spine points to the problem (the effect), while angled bones branch off into major cause categories—commonly people, processes, equipment, and environment.
Team members brainstorm specific contributing factors under each branch: for example, insufficient training under people, handoff delays under processes, or outdated software under equipment. Forcing the team to consider multiple domains simultaneously prevents them from jumping to a single explanation and surfaces overlooked factors. Once the diagram is populated, the team can prioritize the most likely causes through discussion or voting and verify them with data, turning a vague problem into testable hypotheses.
Mind Map
A mind map organizes early-stage brainstorming by placing a central topic in the middle of a canvas and branching outward in any direction as participants add features, risks, and questions. This unstructured layout mirrors associative thinking, letting teams capture ideas quickly without worrying about hierarchy.
As the map grows, related concepts cluster around shared themes, which teams can highlight using connecting lines or color-coded branches. Once brainstorming settles, the team can review the branches, identify dependencies or gaps, and convert prioritized clusters into project scope, deliverables, milestones, or backlog items.
Milestone Chart
A milestone chart distills a project timeline into key deliverables and their target dates, typically marking each milestone with a symbol (such as a diamond), a brief label, and a date. By stripping away day-to-day tasks and complex dependencies, it gives executive sponsors and external stakeholders a high-level summary of whether the project is on track. Sponsors with limited time can quickly review critical checkpoints in presentations or status reports to discuss resource allocation, risk, and strategic alignment without getting lost in operational clutter.
Cumulative Flow Diagram
A Cumulative Flow Diagram (CFD) tracks the number of work items in each process stage over time, stacking those counts into colored bands (such as Backlog, In Progress, Review, and Done). The vertical thickness of a band shows how much work sits in that state on a given day. If an intermediate band widens while the “Done” band stays flat, a queue is building up.
The slope of the top edge indicates the work arrival rate, while the slope of the bottom band indicates the completion rate. Diverging slopes mean work is entering the system faster than it leaves. Parallel, gently rising bands reflect stable flow and predictable cycle times, whereas a steepening bulge in one band signals a capacity shortage or policy constraint in that stage. Because a CFD aggregates all items rather than tracking single tickets, Kanban teams use it during retrospectives to diagnose systemic bottlenecks and see whether adjustments—like changing WIP limits or adding a reviewer—successfully straighten the bands.
Dashboard
A project management dashboard consolidates high-level key performance indicators (KPIs), schedule progress, budget-versus-actual figures, and risk metrics into a single, real-time view. Instead of cross-referencing scattered spreadsheets and emails, leaders can see how spending relates to delivery at a glance.
Dashboards pair delivery metrics with forward-looking risk indicators—such as open issues and severity trends—using color-coded, traffic-light conventions so leaders can scan for exceptions and intervene before problems escalate. When connected to underlying project tools for automatic refreshes, a dashboard reflects current conditions rather than last week’s status meeting, reducing manual reporting for project managers while allowing executives to drill down into details when questions arise.
Frequently Asked Questions
What is a Gantt chart used for in project management?
A Gantt chart maps a project schedule along a horizontal timeline, with each task shown as a bar whose length corresponds to its duration. It helps project managers see the overall timeline, spot bottlenecks, illustrate task dependencies, and track planned versus actual progress.
How do WIP limits work on a Kanban board?
A WIP limit sets a maximum number of cards allowed in active columns like In Progress or Review. Once a column reaches its cap, no new work can enter until an existing card moves forward, forcing the team to finish started work before taking on more.
How does a PERT chart estimate task durations?
PERT uses three-point estimates: optimistic time, pessimistic time, and most likely time. These combine into a weighted average, commonly calculated as (optimistic + 4 × most likely + pessimistic) ÷ 6.
What is the critical path in the Critical Path Method?
The critical path is the longest sequence of dependent tasks, and because it has no slack or float, its total duration sets the minimum timeline for the project. Any delay on a critical task pushes the final delivery date back by the same amount.
What are the four RACI matrix roles?
Responsible means the people who perform the work, Accountable means the single individual who owns the outcome, Consulted means subject-matter experts whose input shapes the work, and Informed means stakeholders who need visibility but do not execute the work.
How can a burndown chart tell if a team is behind schedule?
A burndown chart plots work remaining against time and usually includes an ideal burndown line. If the actual line tracks above the ideal line, the team is behind schedule and may need to adjust scope or clear blockers.
Tony Astor
Tony writes about data visualization and the tools people use to build charts and dashboards. More about Data Illustrator