Best Charts for KPIs and Performance Metrics
 By Tony Astor ·

Best Charts for KPIs and Performance Metrics
Line charts track KPI trends over time, bar charts compare discrete categories, stacked bars add composition, and pie or donut charts show part-to-whole shares with five or fewer slices. Gauges and bullet graphs track single values against targets, scatter plots reveal correlation and outliers, and waterfall, funnel, heat map, treemap, and box plot charts handle breakdowns, conversion, patterns, and distribution.
Table of Contents
Line Charts
Line charts track performance trends over time because their structure mirrors how people naturally read change: left to right, past to present. Each point represents a measurement at a specific moment, and connecting them shows how a key performance indicator (KPI) behaves across days, weeks, quarters, or years.
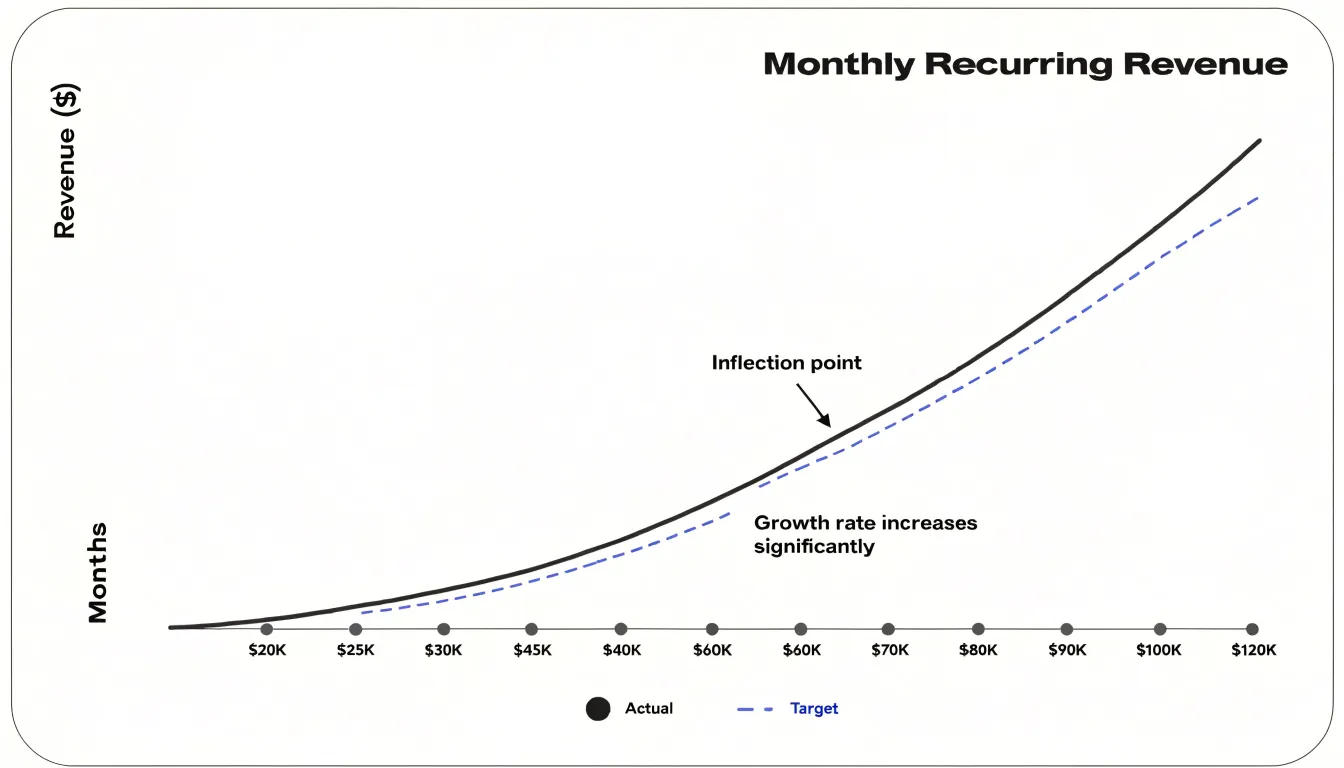
This format makes historical patterns immediately clear. The line’s slope communicates the pace of movement, showing whether a metric is climbing steadily, holding flat, or slipping downward. Cyclical behavior, such as weekly sales rhythms or monthly traffic surges, appears as repeating waves over a long enough window. Seasonal fluctuations also stand out as recurring peaks and troughs against the broader trend, helping analysts separate expected cycles from genuine anomalies that need investigation.
Plotting an extended series also reveals long-term directional shifts: inflection points where growth accelerates, plateaus where momentum stalls, or turning points where a decline begins. These signals help teams decide when to adjust strategy, reallocate resources, or investigate root causes. Adding a comparison line for targets or prior periods lets viewers assess performance against benchmarks at a glance.
Bar Charts
Bar charts compare performance metrics across discrete categories, such as regional sales totals, departmental output, or quarterly targets. Each bar’s length encodes a single category’s value, allowing viewers to rank and compare groups side by side to see which leads, which lags, and by how much.
Vertical bars suit shorter category labels, while horizontal bars accommodate longer names—like products or regions—without awkward text rotation. For performance tracked across time-bound categories like months, quarters, or campaigns, grouped or clustered bars place multiple series next to each other within each period to show both trends and relative standing.
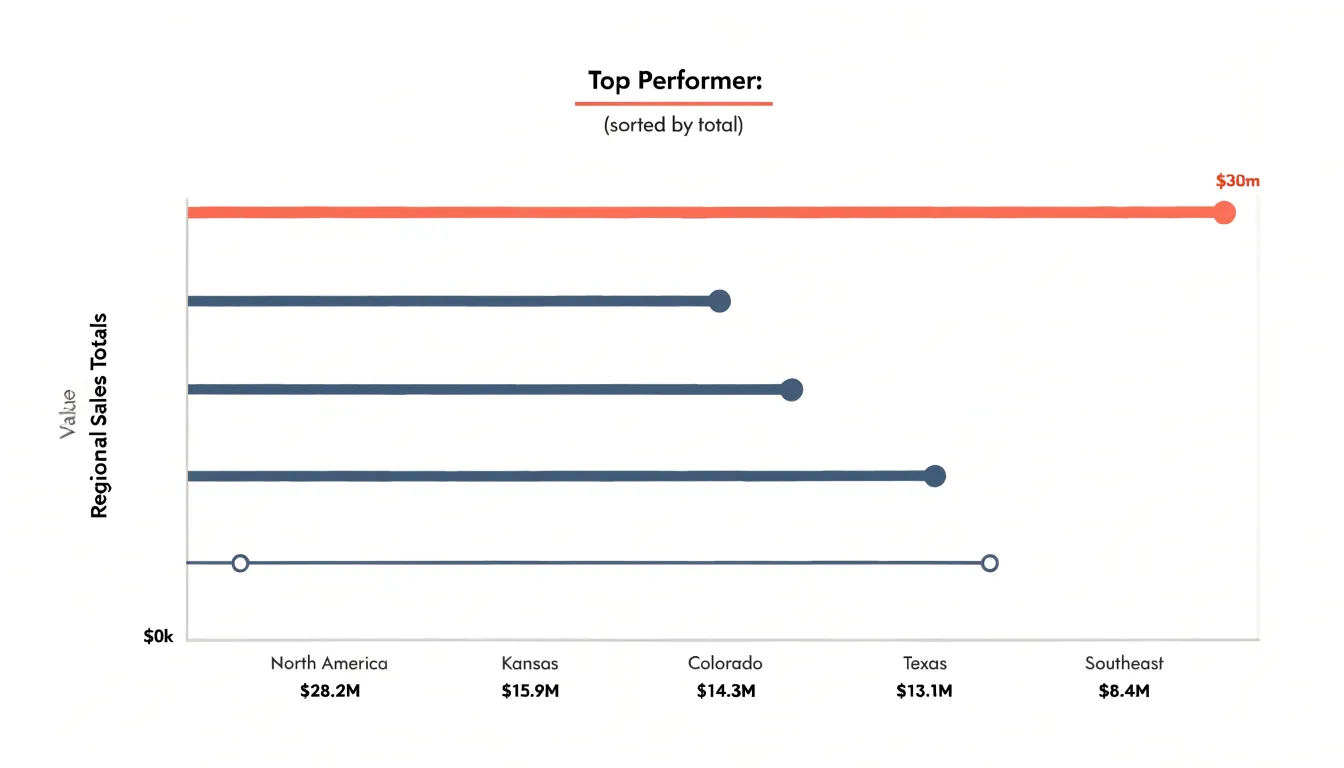
Clarity in a bar chart depends on a few design rules:
- Start the value axis at zero to preserve honest proportions.
- Use consistent bar widths and even spacing to keep a clean visual rhythm.
- Order bars by value rather than alphabetically to create an instant ranking.
- Limit the number of bars to prevent clutter.
- Use color purposefully, such as highlighting a target threshold or top performer, rather than decorating every bar differently.
Stacked Bar Charts
Stacked bar charts carry two layers of information at once: the overall total for each category and the internal composition that produces it. Each bar represents a complete KPI value, such as total monthly revenue, while colored segments within the bar show how individual subcategories contribute to that figure. This dual view is especially useful for regional sales, product-line performance, or channel-level conversions.
To keep a stacked chart readable:
- Limit segments per bar to a small handful, grouping minor contributors into an “Other” category.
- Order segments consistently across bars, typically from the largest contributor at the base to the smallest at the top, so viewers don’t have to re-read the legend.
- Use horizontal stacks for long category labels so text along the left axis remains legible.
- Apply a restrained palette with clear contrast between adjacent segments, reserving a distinct color for underperformance or outliers.
- Add total values at the end of each bar or above the stack so viewers don’t have to estimate the headline number, and use interactive tooltips or callouts for exact subgroup figures.
Pie and Donut Charts
Pie and donut charts show part-to-whole relationships in a single shape, where each slice represents a category’s share and the full circle equals 100%. Donut charts use the same logic but open the center for a summary figure, such as the aggregate value or the leading category’s percentage.
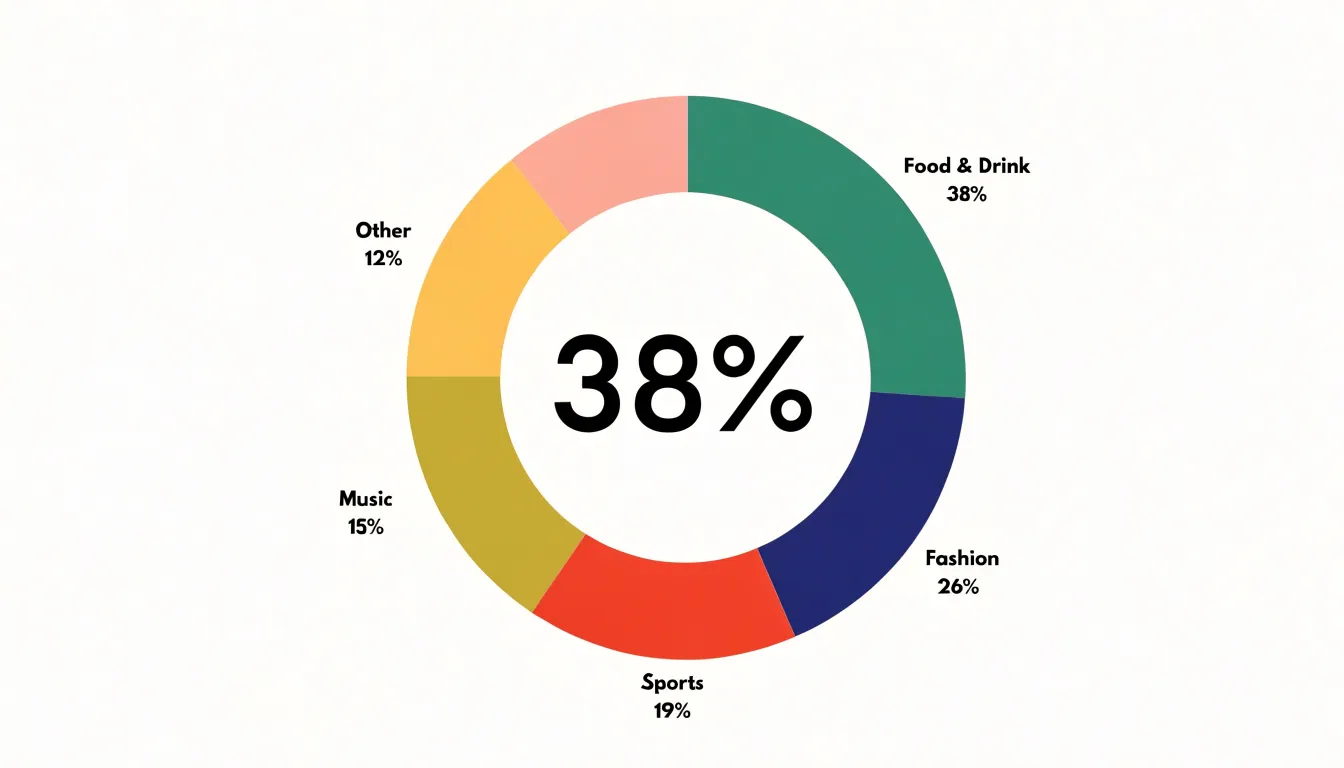
These charts work best with five or fewer slices. Because human perception compares angles and arc lengths less precisely than aligned bar lengths, extra slices make it harder to distinguish shares. If you have more than five categories, consolidate the smallest into an “Other” group.
To support accurate reading:
- Order slices by size starting at the 12 o’clock position and moving clockwise.
- Label slices directly with the category and percentage to reduce back-and-forth with a legend.
- Choose accessible color palettes whose tones remain distinct for viewers with color vision deficiencies.
- Apply the chart to one total only. Placing two pie charts side by side invites slice-size comparisons across circles, where small angle differences are difficult to judge reliably.
Gauge Charts
Gauge charts present a single value against a defined scale using a radial dial, like a speedometer. A needle or filled arc indicates where current performance sits relative to a target, while colored bands mark thresholds for acceptable, warning, and critical zones. When the needle crosses into an amber or red segment, it signals urgency before anyone reads the underlying number.
Gauges work best for real-time monitoring of a single goal with a genuine target, such as a sales team tracking quarterly revenue, an operations group watching throughput against a service-level threshold, or a support desk monitoring average response time against a committed maximum. Because each gauge has a compact footprint and carries one message, they suit executive summaries where the audience needs quick orientation rather than deep analysis. Keep the number of dials modest and label thresholds clearly.
Bullet Graphs
Bullet graphs offer a compact, information-dense alternative to gauges for tracking performance against targets and historical benchmarks. A single bullet graph displays the current value as a prominent horizontal bar, accompanied by a target marker and set against qualitative performance ranges—typically shaded bands such as light gray for poor, medium gray for acceptable, and dark gray for good. Many implementations also include a thin vertical line or tick mark for a prior period’s value, creating a three-way comparison: where the metric stands now, where it stood before, and where it should be.
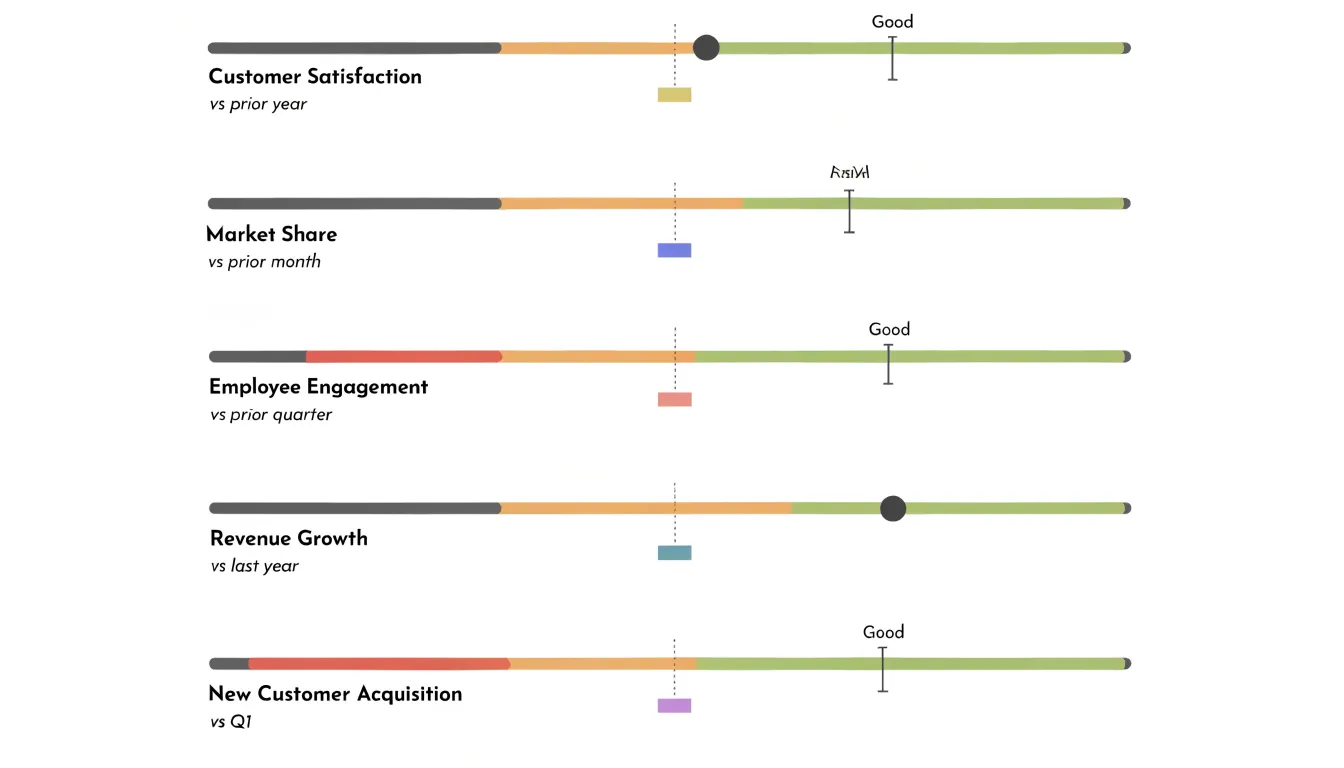
While a circular gauge wastes much of its footprint on decorative elements to show one value, dozens of slim, horizontal bullet graphs can fit in the same space. Their linear format also makes it easy to sort and align metrics in a column so viewers can scan down and spot lagging indicators without scrolling.
Scatter Plots
Scatter plots place one numerical performance factor on the horizontal axis and another on the vertical axis, drawing a point for each observation at their intersection. This reveals how two measures move together—such as marketing spend versus campaign conversions, support response time versus customer satisfaction, or machine downtime versus output volume.
Viewers typically look for three signals:
- Correlation: Points drifting upward from left to right show that higher values of one factor accompany higher values of the other; a downward slope shows they move in opposite directions. A tight band indicates a strong connection, while a loose cloud suggests a weak one.
- Clusters: Grouped points often represent a distinct segment, region, product line, or time period, exposing differences that summary averages hide. A sales team might find that one customer tier pairs high order frequency with low order value while another does the opposite.
- Outliers: Because scatter plots preserve every individual observation, points sitting far from the main body stand out immediately, flagging data quality problems, one-off events, or exceptional performers.
Area Charts
Area charts build on line charts by filling the space beneath the line with color or shading. While the line’s height shows the value at any moment, the shaded mass below communicates accumulated volume—making area charts ideal for cumulative quantities like total revenue, cumulative sign-ups, aggregated ticket volume, or processed transactions.
They work best when the horizontal axis represents continuous time, such as weekly intervals across a quarter or daily values across a season, where the uninterrupted fill reinforces a flowing, cumulative process. Stacked variants layer several series within a single filled region to show both overall magnitude and each component’s contribution. Keep the number of overlapping series modest, choose clearly separated shades, and label totals where the cumulative figure matters most.
Waterfall Charts
A waterfall chart breaks a total into its component parts using floating bars to show how an opening value moves step by step through positive additions and negative deductions to reach a closing net result. Each bar begins where the previous one ended, allowing viewers to see the relative weight of each contributor without mentally subtracting values.
For a revenue KPI, the opening balance sits on the left as a full column. New customer revenue and expansion revenue add bars rising above that baseline, while churn and downgrades push the running total downward before landing on the final closing column.
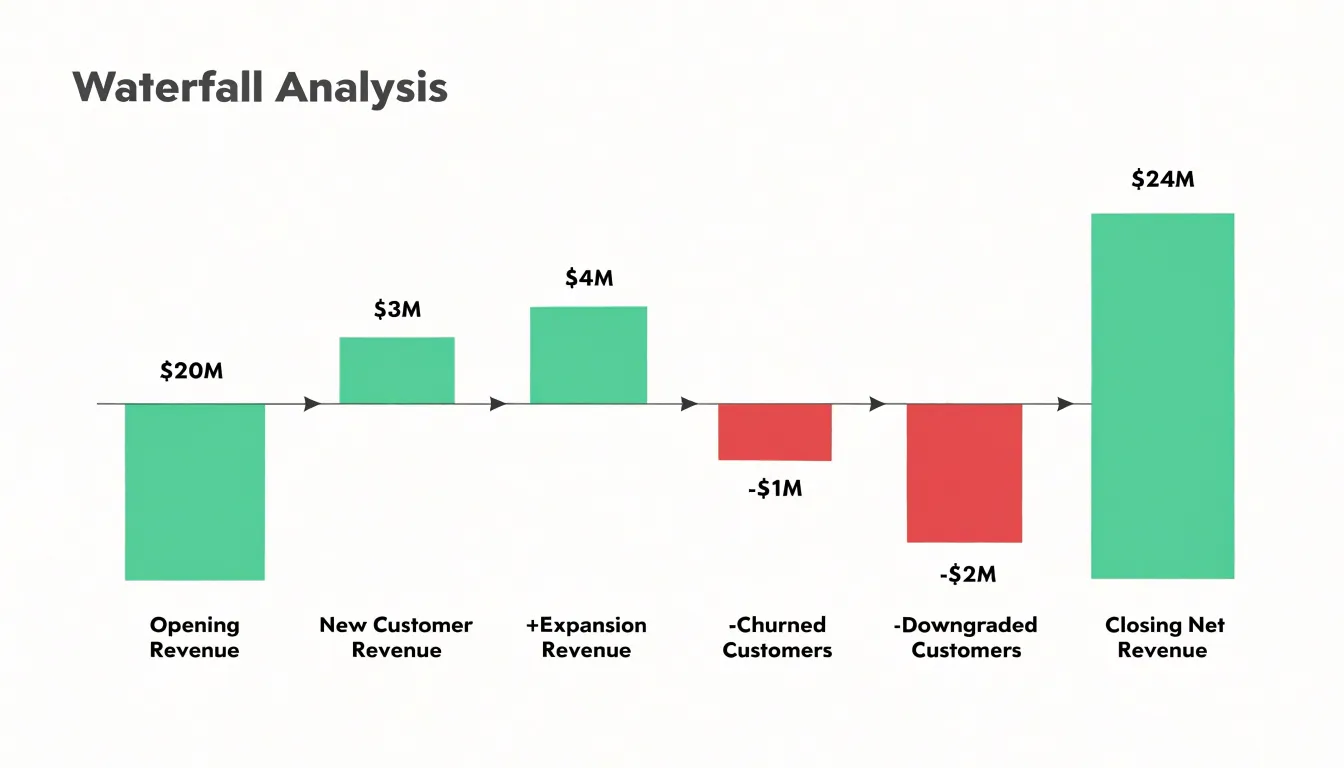
Mapping each increment or deduction to a specific driver—such as pricing changes, seasonal demand, or promotional campaigns—turns the chart into a diagnostic tool for budget reconciliation and performance reviews. It also keeps offsetting forces visible side by side, even when a large gain and a large deduction nearly cancel out. Use color coding to distinguish increases from decreases, and label totals and categories clearly.
Funnel Charts
Funnel charts map conversion through a multi-step process using horizontal bars that narrow as they descend, with each bar’s width proportional to the count at that step. A wide top section represents the full entering population, and subsequent sections show the surviving subsets, making progressive drop-off immediately obvious.
In a sales pipeline moving from leads generated to qualified prospects, proposals sent, negotiations, and closed deals, the steepest contraction immediately shows which transition needs scrutiny. Funnels also suit customer acquisition journeys (website visits, sign-ups, trial activations, paid conversions) and marketing sequences (awareness, consideration, purchase).
Funnel charts require stages that are genuinely sequential and mutually exclusive, so every person in a lower bar is also counted in the bars above it. Processes with branching paths or re-entry must be simplified to remain readable. Annotating conversion rates between adjacent stages shows transition efficiency alongside absolute volume, and comparing funnels across time periods or segments reveals whether a drop-off is chronic or recent.
Heat Maps
Heat maps translate a two-dimensional grid of numbers into color, assigning each cell a shade whose intensity matches its value. The eye goes naturally to the darkest or brightest clusters—signaling concentrations of events, revenue, errors, or engagement—while pale cells reveal quiet zones.
Heat maps excel at pattern recognition and prioritization across several monitoring setups:
- Calendar grids track daily operational activity across weeks and months, exposing seasonal rhythms and outlier days.
- Weekday-by-hour grids show when user engagement peaks to guide staffing or campaign timing.
- Website page overlays reveal where visitors click, scroll, and linger versus which sections they overlook.
Use a sequential color scale for data running from low to high, and a diverging scale when values fall on either side of a meaningful midpoint like a target or baseline. Include clear labels, a legend, and consistent cell sizing.
Treemaps
Treemaps break down nested hierarchical data using rectangles whose areas are proportional to their quantitative values. This makes them effective for multi-level metrics like organizational budgets, product-line revenues, or website traffic by channel and subchannel.
The largest rectangles draw attention to major contributors, while smaller rectangles preserve less dominant elements. Color can encode a second variable, such as profit margin or year-over-year growth, adding insight without extra clutter.
To keep treemaps readable, use borders or spacing to make hierarchical groupings distinct, ensure labels fit cleanly, and add interactive tooltips or drill-down capabilities for exploring deeper levels. Avoid treemaps when you need precise comparisons between similarly sized items or when your dataset includes negative values.
Box Plots
A box plot summarizes an operational dataset’s distribution using five numbers: minimum, first quartile (25th percentile), median, third quartile (75th percentile), and maximum.
- The box spans the interquartile range (the middle half of observations), measuring process consistency. A narrow box signals stable, predictable performance clustered around the center; a wide box indicates high variability that may warrant workflow investigation.
- The median line inside the box provides a central anchor that resists distortion from extreme values.
- Whiskers extend outward to show the range of typical values.
- Outlier points beyond the whiskers flag data entry errors, exceptional events, or process failures requiring follow-up.
Placing box plots side by side lets viewers compare medians and spreads across teams, regions, or time periods, making them well suited for tracking service times, defect rates, and transaction values.
Metric Cards
Metric cards isolate a single critical number—such as total revenue, customer acquisition cost, or net promoter score—in a large font for instant executive focus. Alongside the headline figure, a percentage change against a prior month, quarter, or year provides context, often color-coded (such as green for positive, red for negative) to show direction.
Adding a sparkline—a tiny, minimalist line chart—illustrates movement over time, revealing steady growth, seasonal fluctuations, or sudden dips without cluttering the card. Used with uniform sizing and typography, a row of metric cards provides a cohesive overview and serves as a gateway to deeper reports when a number raises questions.
Dashboards
A dashboard combines complementary visuals on one canvas so related metrics read as a single story: a metric card anchors the current state, a line chart shows the trend over time, and a stacked bar chart breaks down categories.
Effective dashboards rely on two layout principles:
- Grouping: Visuals describing the same process or department should sit close together on a consistent grid. Pairing a revenue trend line with a regional breakdown and a conversion rate scorecard helps viewers connect related numbers and spot cause and effect—such as how a traffic spike affects conversions.
- Hierarchy and consistency: Make the most important KPI the largest and most prominent element, with supporting visuals in secondary positions. Use consistent color coding, shared axes where appropriate, and uniform date ranges so individual charts reinforce rather than contradict one another.
Frequently Asked Questions
What chart is best for tracking KPI trends over time?
Line charts track performance trends over time because their structure mirrors how people read change from left to right, past to present. Each point represents a measurement at a specific moment, and connecting them shows how a KPI behaves across days, weeks, quarters, or years.
What are bar charts used for?
Bar charts compare performance metrics across discrete categories such as regional sales totals, departmental output, or quarterly targets. Each bar’s length encodes a category’s value so viewers can rank and compare groups side by side.
How many slices should a pie chart have?
Pie and donut charts work best with five or fewer slices. If there are more than five categories, consolidate the smallest into an “Other” group.
When should I use a bullet graph instead of a gauge?
Bullet graphs are a compact, information-dense alternative to gauges for tracking performance against targets and historical benchmarks. A single bullet graph shows the current value, a target marker, qualitative performance ranges, and often a prior-period marker.
What can a scatter plot reveal?
Scatter plots reveal how two numerical performance factors move together, such as marketing spend versus campaign conversions. Viewers typically look for correlation, clusters, and outliers.
What is a waterfall chart used for?
Waterfall charts break a total into component parts using floating bars to show how an opening value moves through positive additions and negative deductions to a closing net result. For a revenue KPI, they can show new customer revenue and expansion revenue as additions, while churn and downgrades push the running total downward.
Tony Astor
Tony writes about data visualization and the tools people use to build charts and dashboards. More about Data Illustrator