Best Charts for Health and Medical Data
 By Tony Astor ·

Best Charts for Health and Medical Data
Line charts best track daily symptoms over time, bar and column charts compare treatments and before-after outcomes, scatter plots reveal correlations between variables, heat maps expose patterns across many nights, and histograms show data distribution. Other options include dual axis, Gantt, bullet, area, body diagram, radar, multi-line, and dashboard charts.
Table of Contents
Line Charts
Line charts offer a natural fit for tracking daily symptoms because they preserve the sequence and continuity of each entry, showing how a person’s condition evolves from one day to the next. When someone logs symptom severity on a consistent scale each day—whether pain, fatigue, shortness of breath, or mood—those individual data points connect into a continuous line that reveals the shape of their experience over weeks and months. This continuous form matters for long-term recovery, since healing rarely follows a straight path. A line chart makes it easy to see gradual declines in severity, plateaus where progress stalls, and occasional spikes that might otherwise be forgotten between doctor visits.
For patients managing chronic conditions or recovering from surgery, illness, or injury, a steady downward slope over several weeks provides concrete evidence of improvement that a single day’s rating cannot convey. Conversely, an upward trend that persists across multiple entries signals the need for medical attention. Because the x-axis represents time in equal daily increments, gaps in logging are visible, and users can see whether a missing entry coincided with a particularly difficult period.
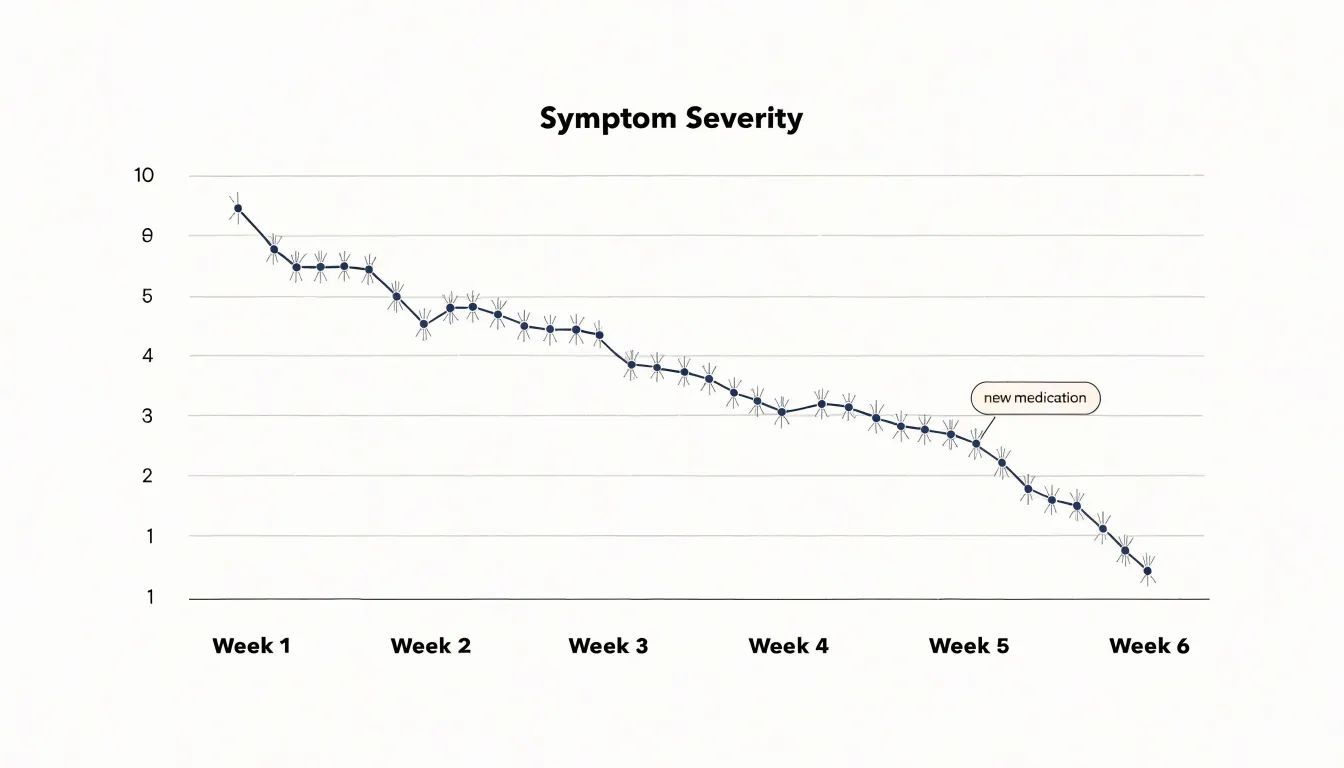
Clinicians benefit from these charts as well. A compact line graph summarizing four to six weeks of daily entries gives a far richer picture than a verbal recollection of how things have been. Patterns such as weekend dips, cyclical flare-ups, or responses to a new medication become apparent when the data is plotted continuously. Many symptom-tracking apps use this format by default, allowing users to overlay multiple symptoms as separate lines for comparison. With clear axis labels, a consistent severity scale, and markers for key events like medication changes, a line chart turns scattered daily logs into a coherent record of recovery that supports both self-management and clinical decisions.
Bar Charts
Bar charts offer a direct way to compare treatment results when weighing one botanical blend or aromatherapy protocol against another. Each bar represents a distinct formula, dose, or protocol, and its length corresponds to a measured outcome such as symptom reduction, sleep quality, or stress score. When several remedies are tested against the same personal benchmark, placing their bars side by side makes differences in performance immediately visible, showing which blend produced the strongest response and by how much.
Horizontal or vertical bars can accommodate multiple categories, such as lavender versus chamomile versus a custom essential oil blend, while grouped or stacked bars add a second dimension for tracking outcomes across several benchmarks at once. A grouped bar chart might show each blend’s effect on anxiety, sleep latency, and perceived energy in separate clusters, giving a compact overview of the full performance profile. Stacked bars work well when individual components contribute to a total score, such as combined relief across several symptoms.
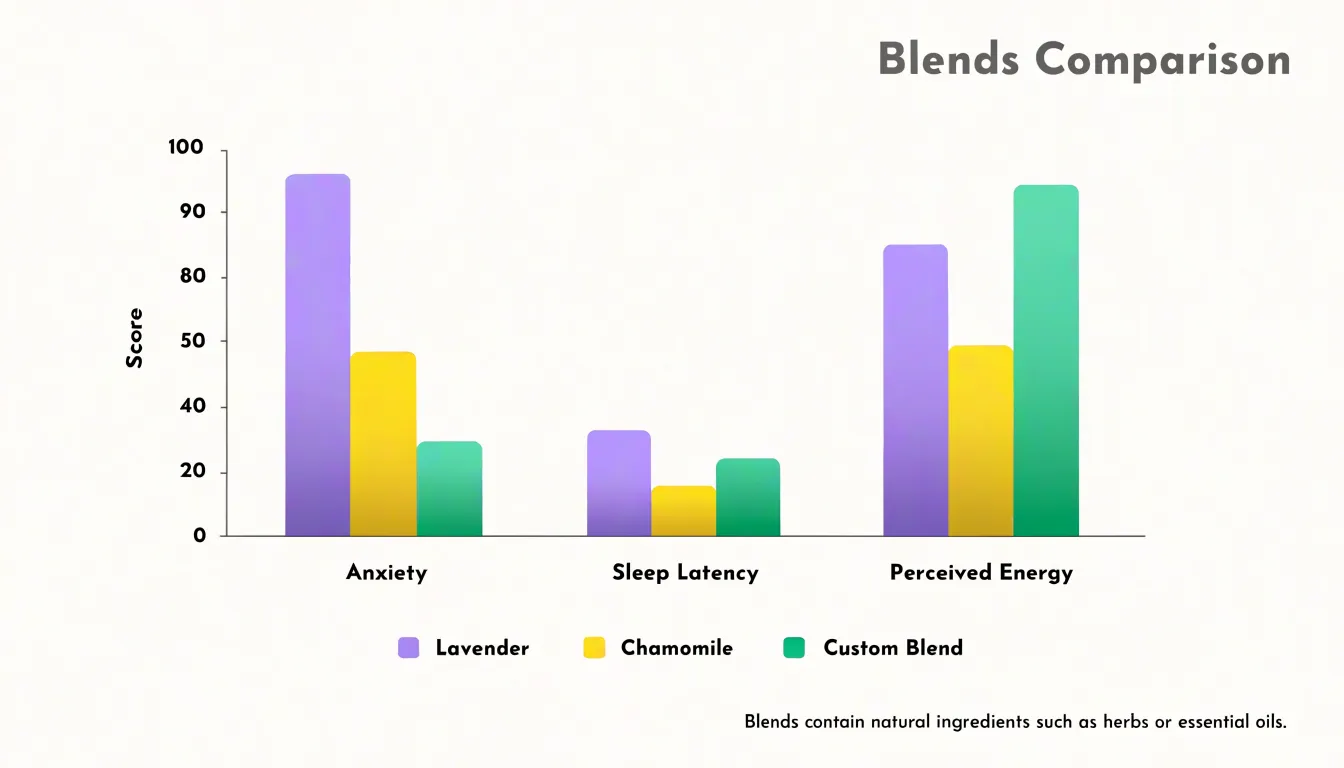
Consistency in scale and labeling keeps these comparisons trustworthy. A shared axis with clearly marked units, uniform bar widths, and consistent color coding for each protocol help the reader interpret results without confusion. Ordering bars from highest to lowest performance, or grouping them by treatment type, supports quick visual scanning. Annotations noting sample size, duration of use, or measurement conditions can be added beneath the chart to give context to the comparison.
Scatter Plots
Scatter plots reveal relationships between two continuous variables, making them ideal for exploring how essential oil usage timing relates to physiological readings such as resting blood pressure. By plotting time since oil application on the horizontal axis and systolic or diastolic blood pressure on the vertical axis, each data point represents a single measurement. If blood pressure tends to decrease within a certain window after application, the points will cluster along a downward slope. This visual approach helps identify correlations that might be missed in summary statistics alone.
Researchers can also spot outliers—unusually high or low readings—that may warrant further investigation, such as an adverse reaction or a measurement error. Adding a trend line or regression curve clarifies the direction and strength of the relationship, while color-coding points by individual or oil type can reveal subgroup differences.
In health and medical data, scatter plots are particularly useful for hypothesis generation: a visible pattern suggests a testable association between timing and physiological response. However, correlation does not imply causation, and other factors like stress, medication, or activity level should be considered. Using transparency to handle overlapping points, alongside clear scales, makes it easier to explore the timing and magnitude of blood pressure changes in response to essential oil use.
Heat Maps
Heat maps turn many nights of sleep data into a single color-coded grid, with each row representing one night and each column a time block across the sleep window. The color scale runs from deep cool tones for consolidated sleep through warm tones for wakefulness, so a viewer can scan dozens or hundreds of nights at once and spot structure that line-by-line logs would hide. When short awakenings cluster at the same clock time night after night, the resulting vertical stripe of warm color is immediately visible as a recurring disruption.
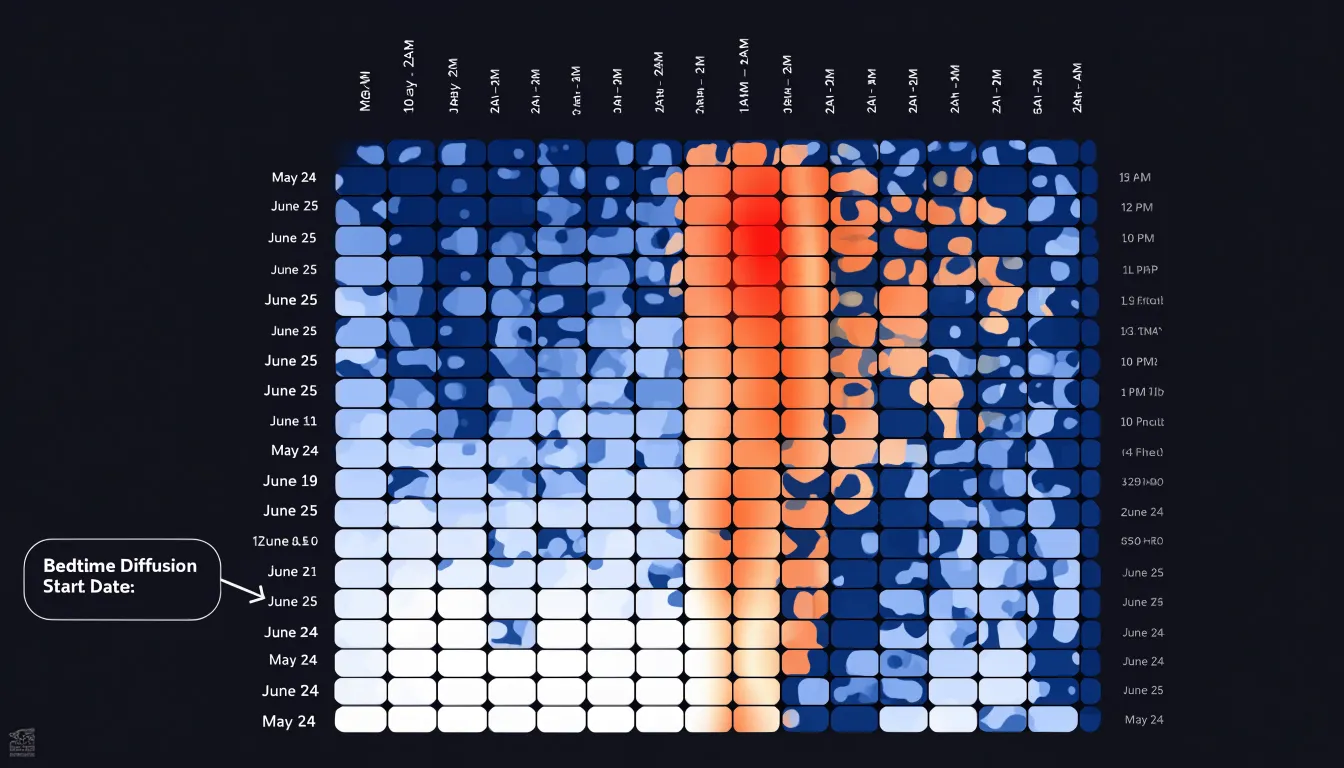
Common patterns emerge quickly in this format:
- A band of activity around three in the morning may point to environmental triggers or natural sleep-cycle transitions.
- Scattered warm speckles spread evenly across many nights suggest fragmented, restless sleep rather than a single cause.
- Blocks of disrupted sleep on weekends or after late shifts become easy to compare against weekday patterns.
The heat map also serves as a clear record of intervention effects. When a bedtime diffusion schedule is introduced, marking the date on the chart lets viewers follow the columns that represent the wind-down window. Nights with a consistent pre-bed routine that includes essential oil diffusion often shift toward cooler colors in those early columns, showing longer time to first awakening and fewer interruptions through the night. Because the change appears as a broad color shift across many rows rather than an isolated data point, viewers can see how quickly the pattern stabilizes after the schedule begins. Pairing the grid with a clear legend, labeled time axis, and annotated intervention dates helps clinicians and readers draw practical conclusions about which routines support steadier sleep.
Histograms
Histograms show how heart rate measurements cluster across defined ranges, making them well suited to studies of heart rate variability before and after calming aromatherapy sessions. Each bar in a histogram represents a range of values, and the height of the bar shows how many readings fall within that range. This structure lets researchers see the overall shape of the data, including where readings concentrate and how widely they spread, without reducing the information to a single average.
When mapping heart rate variability, the analyst first defines sensible bins, such as intervals of five beats per minute, and then counts how many readings fall into each interval for the pre-session and post-session periods. Plotting these counts side by side reveals whether the distribution shifts toward lower or steadier heart rates after aromatherapy, whether the spread of readings narrows, and whether unusual values appear at either end of the scale. A distribution that moves from a broad, uneven shape to a more concentrated one can indicate greater physiological calm, while a persistent tail at high values may prompt a closer look at individual participants or measurement conditions.
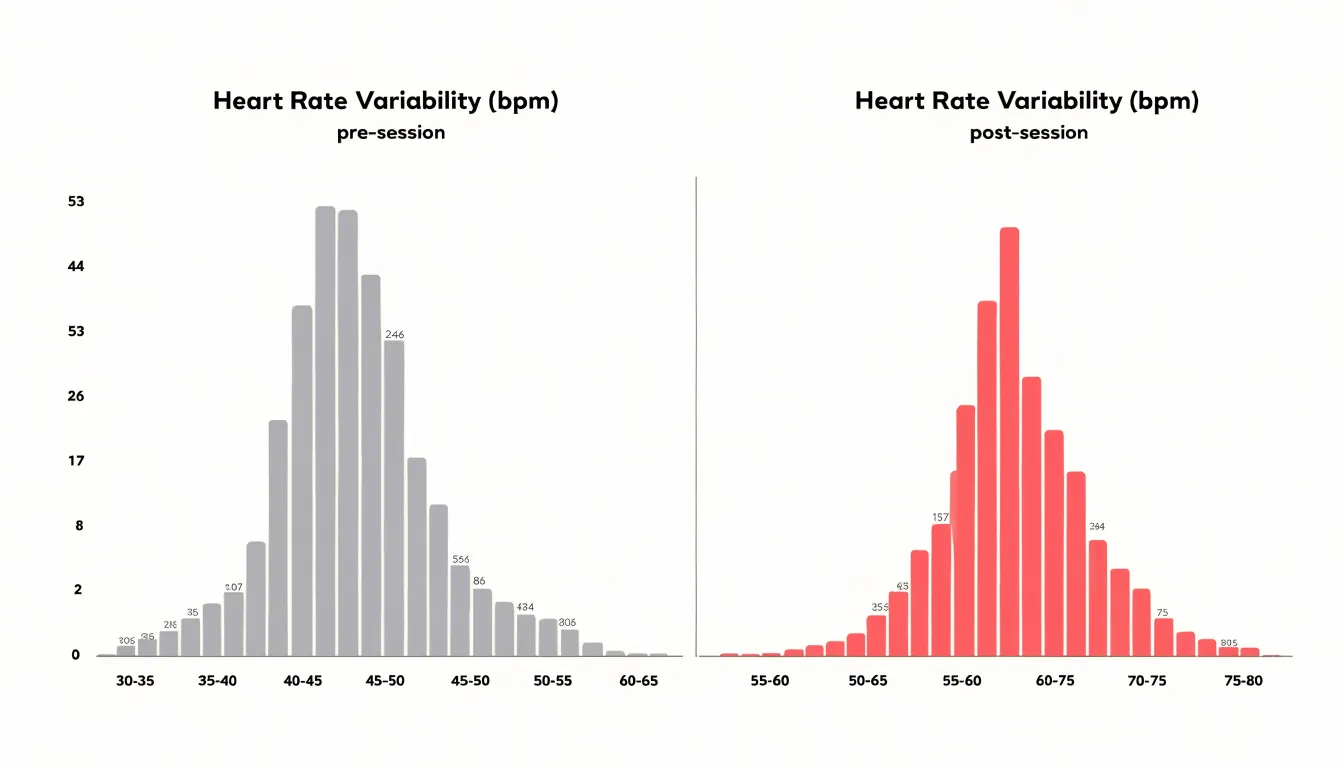
Histograms also help in comparing activity ranges alongside heart rate data. By binning periods of rest, light movement, and more vigorous activity, analysts can check whether heart rate responses differ across these states before and after an intervention. Because histograms display the full distribution rather than a single summary figure, they help analysts decide which summary statistics to report and whether parametric tests are appropriate.
Dual Axis Charts
Dual axis charts examine two related metrics that operate on different scales, such as self-reported anxiety scores and application usage frequency. Plotting anxiety scores on one y-axis and application frequency on the other, with a shared x-axis representing time, allows viewers to observe how changes in one measure correspond with changes in the other. A downward trend in anxiety scores concurrent with an upward trend in app usage could suggest that increased engagement with the therapeutic tool is associated with symptom relief.
The dual axis format accommodates the different units and ranges of the two variables so that neither overshadows the other, capturing both subjective experience and objective behavior. However, distinct colors for each line and a legend that specifies which axis corresponds to which measure are essential to prevent misinterpretation. Like scatter plots, dual axis charts can imply correlation without proving causation, so they should be used as exploratory tools rather than definitive evidence.
Column Charts
Column charts compare treatment outcomes before and after an intervention, such as evaluating the effectiveness of essential oil applications. A study might measure heart rate variability, blood pressure, or subjective stress levels before and after applying lavender oil. Each metric is represented by a pair of vertical bars placed side by side: one for the pre-application measurement and one for the post-application measurement, with bar height corresponding to the average value across participants.
Grouping multiple metrics on the same chart enables comparisons across cardiovascular, respiratory, and psychological domains at once. To keep these comparisons reliable and readable:
- Use color coding to distinguish between the before and after conditions.
- Include error bars to indicate variability, such as standard deviation or standard error, so viewers can assess the reliability of the observed changes.
- Label the metrics and specific time points clearly (e.g., ‘Before’ and ‘After 30 minutes’).
- Limit the number of metrics to those most relevant to the treatment’s expected effects, as too many bars clutter the visual.
Gantt Charts
Gantt charts offer a timeline-based approach to managing complex medication regimens, particularly in botanical protocols and multi-week therapeutic plans. By representing each medication or supplement as a horizontal bar along a time axis, these charts show when each dose is due, how long a course of treatment lasts, and how different components of a protocol overlap.
Botanical protocols often involve multiple herbs taken at different times of day and for varying durations. A Gantt chart can display a two-week course of echinacea alongside a four-week course of astragalus, with daily dosage intervals clearly marked. Dividing the day into segments shows precisely when each dose should be taken—such as every four hours or with meals—making it easier to integrate into daily routines and reducing the risk of missed or duplicated doses. For multi-week plans, the chart provides a shared timeline that helps healthcare providers coordinate care and helps patients adhere to their schedules.
Bullet Charts
Bullet charts give health and wellness dashboards a compact way to show how a daily metric is performing against a defined goal. Each chart displays a single measure—such as steps taken, hours slept, or water consumed—as a horizontal bar that sits within a set of background bands. Those bands represent qualitative ranges (for example, poor, fair, good, and optimal), so a reader can see at a glance whether the day’s value falls inside a healthy zone. A vertical marker line runs through the chart to indicate the specific target threshold for that day, making the distance between actual performance and the goal immediately visible.
Because of their compact footprint, several metrics can be stacked in a narrow column and scanned in a few seconds, which suits daily check-ins where a patient or caregiver wants a fast status read. A sleep tracker might line up duration, resting heart rate, and activity minutes side by side, each with its own target marker and range bands.
The range bands typically use muted tones so the actual value bar stands out clearly, and the target marker should be visually distinct from both. Providing accessible labels or patterns for the bands helps users who cannot rely on color alone. Because bullet charts encode a single value per measure, they work best for summarizing today’s reading against a benchmark rather than showing trends across weeks. Pairing them with a short caption that names the metric, its current value, and the goal keeps the interpretation unambiguous.
Area Charts
Area charts show how respiratory function changes over the course of an inhalation regimen. A filled area chart plots time along the horizontal axis and lung capacity or airflow volume along the vertical axis, with the shaded region beneath the line representing cumulative gains. As a participant continues a eucalyptus or peppermint inhalation routine, the rising band of color makes overall improvement visible even to readers unfamiliar with spirometry values.
The filled volume communicates total accumulated benefit rather than isolated peak readings, so a steady widening of the shaded area signals consistent progress across sessions. The area beneath the curve also accommodates comparison between baseline measurements and later readings, illustrating how much additional airflow capacity has been recovered after several weeks of treatment. Because the shading conveys magnitude as well as direction, area charts suit datasets where the total volume of improvement matters, such as cumulative liters gained or aggregate airflow increases recorded during a structured inhalation program.
Body Diagram Charts
Body diagram charts give patients and practitioners a shared visual language for describing where discomfort lives. Instead of relying on vague verbal descriptions such as “my back hurts” or “somewhere in my shoulder,” a user marks the exact spot on an anatomical outline. Front and back views let people indicate whether pain radiates from the spine outward, sits beneath the shoulder blade, or wraps around the ribs. This precision narrows the list of possible causes and guides the next step in assessment. A well-designed diagram includes enough anatomical detail to distinguish the neck from the upper trapezius, or the lower abdomen from the hip, while remaining simple enough for a non-clinician to complete in under a minute.
The same visual framework supports longitudinal tracking. Symptom logs built around body diagrams let users record intensity, quality, and duration at each marked site, session after session. Over a week or a month, the accumulated entries form a map of change: a headache that migrates from the temples to the base of the skull, or knee soreness that shrinks from a broad region to a single point. Color coding and layered markers can show multiple symptoms at once.
For topical relief routines, a user can log where an essential oil blend was applied, note the dilution and time, then return to the same diagram later to record whether sensation shifted. Repeated entries build a visual history of which areas respond and which do not, giving practitioners a compact record anchored to the geography of the body itself.
Radar Charts
Radar charts, often called spider plots, display multiple health dimensions at once to compare comprehensive wellness profiles. Each axis represents a distinct feature—such as sleep quality, mood, energy level, pain intensity, and stress—and the values are plotted along these axes and connected to form a polygon.
In botanical interventions, radar charts are particularly useful for before-and-after comparisons. By overlaying two polygons—one for baseline and one for post-intervention—readers can see which dimensions improved, which remained stable, and which worsened. A shift toward the outer edge indicates improvement across multiple features, while a shift inward signals deterioration. This holistic view is valuable in wellness research, where interventions often affect several aspects of health simultaneously and single-outcome measures may miss the broader picture.
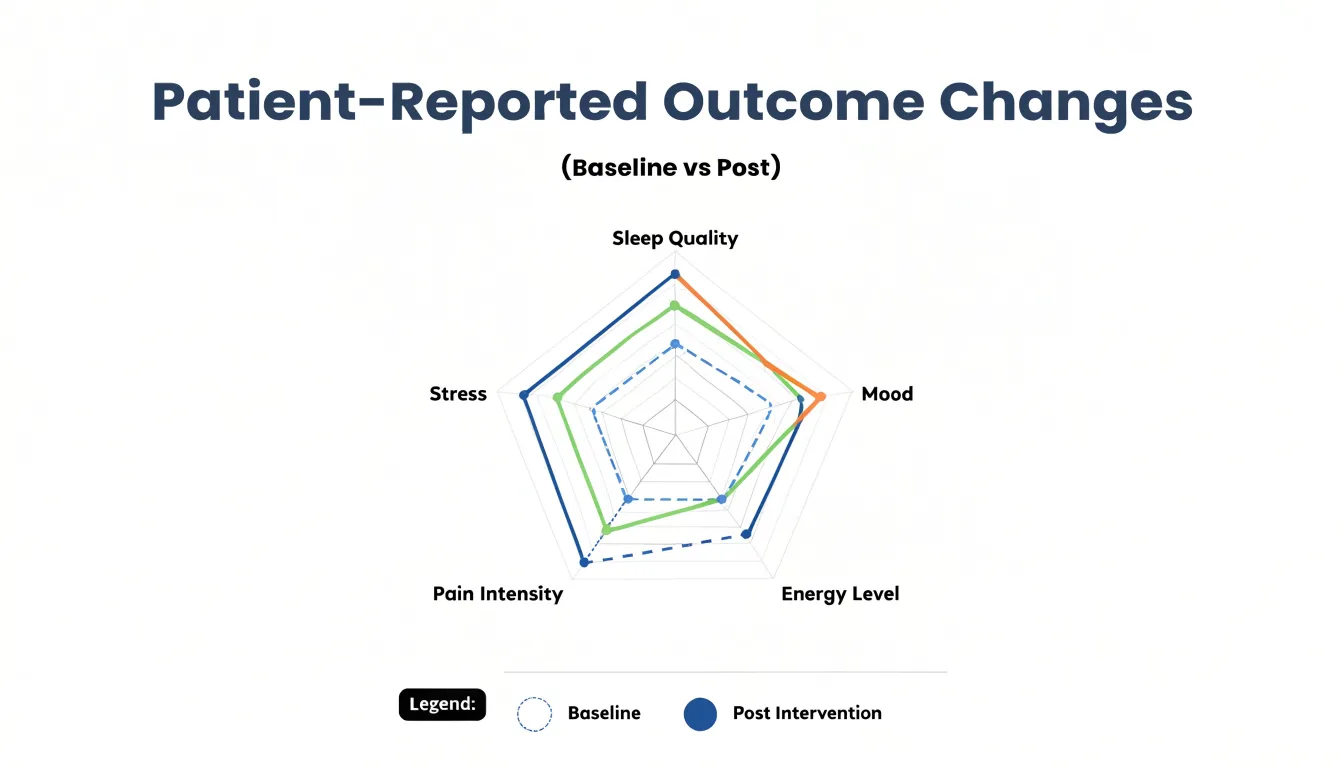
However, radar charts have limitations:
- They work best with five to eight features to avoid visual clutter.
- The ordering of axes can influence perceived patterns, so consistent ordering is essential.
- The area of the polygon is sometimes misinterpreted as a single summary score, which can be misleading because the axes may not be equally weighted or scaled.
Multi-Line Charts
Multi-line charts allow clinicians and patients to observe continuous glucose monitoring readings across many days in a single view. Each line represents one day, with time of day along the horizontal axis and blood sugar values on the vertical axis. By overlaying several days, the reader can see whether readings cluster within a stable band, spike consistently after meals, or dip during the night.
When a patient begins a walking routine after dinner, adjusts carbohydrate portions, or changes sleep timing, they can compare the lines from before and after the change. Because each day appears as its own line, shifts in the shape and spread of the curves stand out without requiring statistical analysis. A narrowing of the band across the day signals improving stability, while repeated excursions at specific times point to areas deserving closer attention.
A few design choices keep a multi-line glucose chart readable:
- Limit the overlay to seven or fourteen days to prevent visual clutter.
- Use consistent color coding, such as shading weekend days differently, to help spot behavioral patterns.
- Include a shaded target range in the background to clarify which excursions fall outside healthy limits.
- Annotate the chart with meal times or exercise sessions to give context to peaks and troughs.
Patients can point to a specific line and connect it to what happened that day, while clinicians gain a quick visual summary of glycemic variability that complements summary statistics like time in range.
Dashboard Charts
A consolidated health monitoring panel brings heart rate, sleep, and symptom trends together in a single view. Daily wellness stats are most useful when read against one another: a resting heart rate creeping upward over the same week that sleep duration falls and fatigue symptoms increase tells a story that no single metric could convey alone.
Designing these panels starts with choosing shared time axes so that every chart in the dashboard refers to the same date range. A common seven-day or thirty-day window lets users scan vertically from heart rate to sleep to symptom entries and spot correlations without recalculating dates. Stacked or aligned small multiples work well here, since each metric keeps its own scale while the horizontal alignment preserves the temporal relationships between them.
Visual hierarchy matters as much as alignment. Heart rate typically appears as a line chart with shaded normal ranges, sleep as stacked bars showing stages or a simple duration column, and symptoms as categorical markers or a frequency heatmap placed along the bottom of the panel. Consistent color coding across all three, such as a single accent hue for elevated readings, reinforces the connection between charts.
Interactivity rounds out the design. Hover tooltips that surface the precise values behind a data point, and synchronized crosshairs that highlight the same day across every chart, let users drill into a specific date when something looks unusual. Filters for week, month, or custom ranges support both quick daily check-ins and longer-term trend review.
Frequently Asked Questions
What is the best chart for tracking daily symptoms over time?
Line charts are a natural fit for tracking daily symptoms because they preserve the sequence and continuity of each entry, showing how severity changes from one day to the next. They can make gradual declines, plateaus, and occasional spikes easier to see over weeks and months.
How can I compare different aromatherapy blends or treatment protocols?
Bar charts can compare treatment results by representing each formula, dose, or protocol as a distinct bar whose length corresponds to a measured outcome. Placing bars side by side makes differences in performance immediately visible.
What chart shows how essential oil timing relates to blood pressure readings?
Scatter plots can plot time since oil application against systolic or diastolic blood pressure, with each point representing a single measurement. The article notes that correlation does not imply causation, and other factors like stress, medication, or activity level should be considered.
What chart can reveal sleep disruption patterns across many nights?
Heat maps turn many nights of sleep data into a color-coded grid, with each row representing one night and each column a time block across the sleep window. Recurring awakenings at the same clock time can appear as a visible vertical stripe of warm color.
How can histograms help compare heart rate variability before and after aromatherapy?
Histograms show how heart rate measurements cluster across defined ranges, and plotting pre-session and post-session counts side by side can reveal whether the distribution shifts toward lower or steadier heart rates. They can also show whether the spread of readings narrows or whether unusual values appear at either end.
What chart is useful for managing a multi-week botanical or medication schedule?
Gantt charts represent each medication or supplement as a horizontal bar along a time axis, showing when each dose is due, how long treatment lasts, and how protocol components overlap. This timeline approach can make it easier to integrate doses into daily routines and reduce the risk of missed or duplicated doses.
Tony Astor
Tony writes about data visualization and the tools people use to build charts and dashboards. More about Data Illustrator