Best Charts for Budgets: Showing Spending Clearly
 By Tony Astor ·

Best Charts for Budgets
The best charts for budgets depend on the question being asked: pie and donut charts show each category’s share of total spending, bar charts compare category amounts and month-to-month changes, line and area charts track trends and accumulation over time, waterfall and Sankey diagrams trace how income is depleted or routed, and bullet graphs, treemaps, and dual axis charts highlight targets, hierarchy, and income-versus-expense gaps.
Table of Contents
Pie Chart
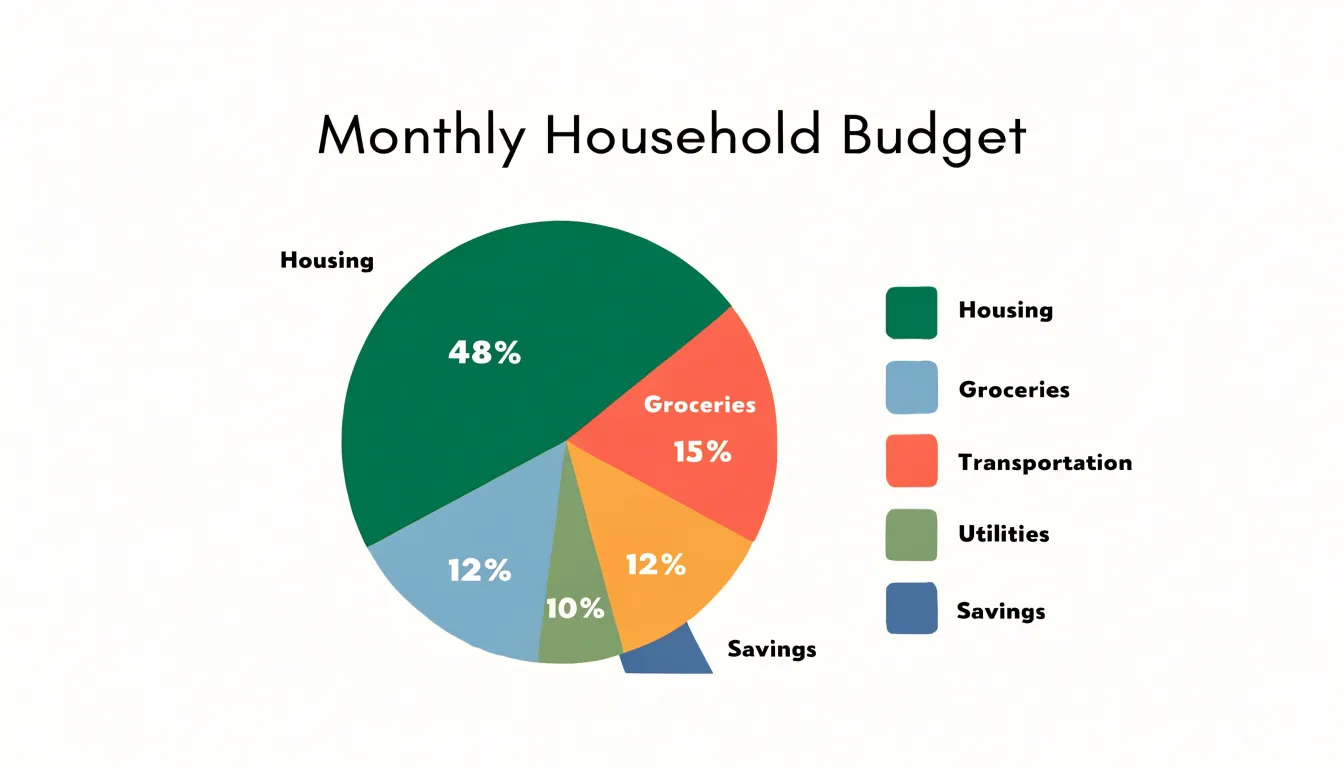
A pie chart turns a budget into a single, intuitive picture where each expense category is represented as a slice of a whole. The size of each slice corresponds directly to its share of total spending, so the largest categories stand out immediately. Housing, groceries, transportation, and utilities often dominate a typical budget, and on a pie chart these appear as the most prominent wedges. This visual hierarchy allows you to spot major expense categories at a glance without scanning rows of numbers. When a category like housing takes up nearly half the chart, the weight of that cost becomes obvious, prompting you to evaluate whether it aligns with your financial goals. Similarly, if groceries form a larger slice than expected, the chart signals a potential budget leak that might otherwise go unnoticed in a spreadsheet. The proportional nature of the pie makes comparisons straightforward: a slice that is twice as large represents twice the spending, so you can quickly assess which categories are consuming the most resources. This immediate recognition is especially useful for monthly budget reviews, where time is limited and the goal is to identify areas for adjustment. By focusing attention on the biggest slices, a pie chart helps you prioritize where to cut back or reallocate funds. It also highlights imbalances, such as a small slice for savings or debt repayment, which can motivate corrective action. In essence, the pie chart’s strength lies in its ability to distill complex budget data into a simple, visual summary that makes major expense categories and potential leaks instantly apparent, empowering faster and more informed financial decisions.
Bar Chart
A bar chart turns a monthly budget into a set of comparable columns or rows, letting you see at a glance how spending in each category stacks up against the others. In a vertical layout, each expense category—housing, groceries, transportation, utilities, entertainment—gets its own bar rising from a shared baseline, so the relative height of each bar communicates the size of that expense without requiring you to read a single number. A horizontal layout works the same way, with bars extending left to right, and it becomes especially useful when category names are long, since the labels sit comfortably beside each bar rather than crowding underneath.
The real strength of the format shows up when you place several months side by side. Group the bars by category and color them by month, and each cluster becomes a small month-to-month comparison: you can see whether the grocery bars are creeping upward across three or four months, or whether the transportation bar spiked in a single month because of a repair or a trip. Reading these patterns takes seconds, which matters when the goal is a quick monthly check-in rather than a deep statistical review.
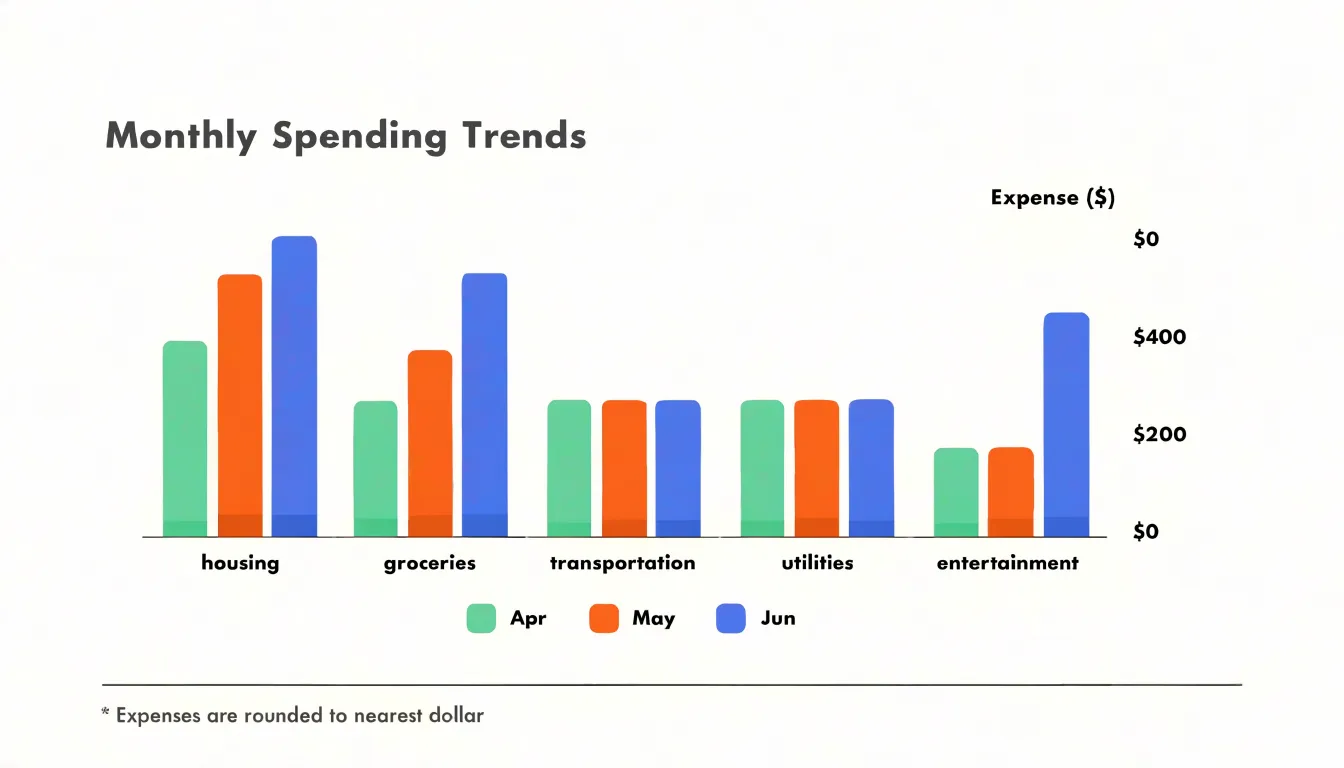
The discrete nature of spending categories suits bars particularly well. Each category is a separate, countable thing, and each bar represents exactly one of them, so there is no ambiguity about what a particular shape refers to. The shared baseline gives every bar the same starting point, which keeps the comparison honest and intuitive. Viewers instinctively compare lengths, so the chart does most of the interpretive work for them.
For a household or a small team reviewing a budget, this means faster conversations and clearer decisions about where to trim or where to plan ahead.
Stacked Bar Chart
A stacked bar chart takes the total spending figure for each category and divides that single bar into segments representing the individual sub-expenses that make up the total. One bar might represent total monthly food spending, with its segments marking groceries, dining out, and coffee shops. Because every segment sits directly on top of the others, the height of the full bar communicates the category total, while the internal divisions show exactly how that total was assembled. This layered view gives budget readers two levels of information in a single visual: the broad trend of overall spending and the specific components responsible for it.
The value of this structure becomes clear when totals shift from month to month. When a category’s bar grows taller, the stacked segments show which sub-expenses expanded and by how much. A rising household budget bar might be driven mostly by one growing segment such as utilities, while the other segments hold steady. Readers can trace that growth to its source without consulting a separate table or drilling into a second chart. The same logic applies when a bar shrinks, revealing which sub-categories were trimmed to produce the savings.
Stacked bars also support comparison across categories. Placing several stacked bars side by side lets viewers compare both overall category totals and the internal composition of each. A reader can see at a glance that housing consumes the largest share of the budget while also noting how its segments, such as rent, insurance, and maintenance, divide that share. This dual comparison helps decision-makers weigh where spending is concentrated and which specific line items offer the most room for adjustment. The chart works best when segments are kept to a manageable number and ordered consistently across bars, so that each sub-category appears in the same position and color throughout.
Line Graph
A line graph excels at tracking spending trends over time by connecting continuous data points, such as monthly or quarterly expenses, into a clear visual narrative. Each point represents a specific period’s total spending, and the line’s trajectory reveals how expenditures evolve. This continuous mapping is particularly effective for highlighting seasonal fluctuations—for example, a spike in spending during the holiday season or a dip in summer months—because the line’s peaks and valleys make these patterns immediately apparent. Long-term habits also emerge, such as a gradual increase in monthly subscriptions or a consistent rise in operational costs over years. By visualizing data across multiple quarters or years, a line graph allows budget analysts to distinguish between one-time anomalies and recurring patterns. This historical perspective supports more accurate forecasting: if spending consistently surges in the fourth quarter, future budgets can allocate additional funds accordingly. The graph’s simplicity—time on the x-axis and spending amount on the y-axis—makes it accessible to stakeholders at all levels, facilitating data-driven discussions. Moreover, overlaying multiple lines (e.g., actual vs. budgeted spending) enables direct comparison, highlighting variances that inform corrective actions. In essence, the line graph transforms raw financial data into a story of financial behavior over time, empowering organizations to anticipate future needs and adjust strategies proactively.
Waterfall Chart
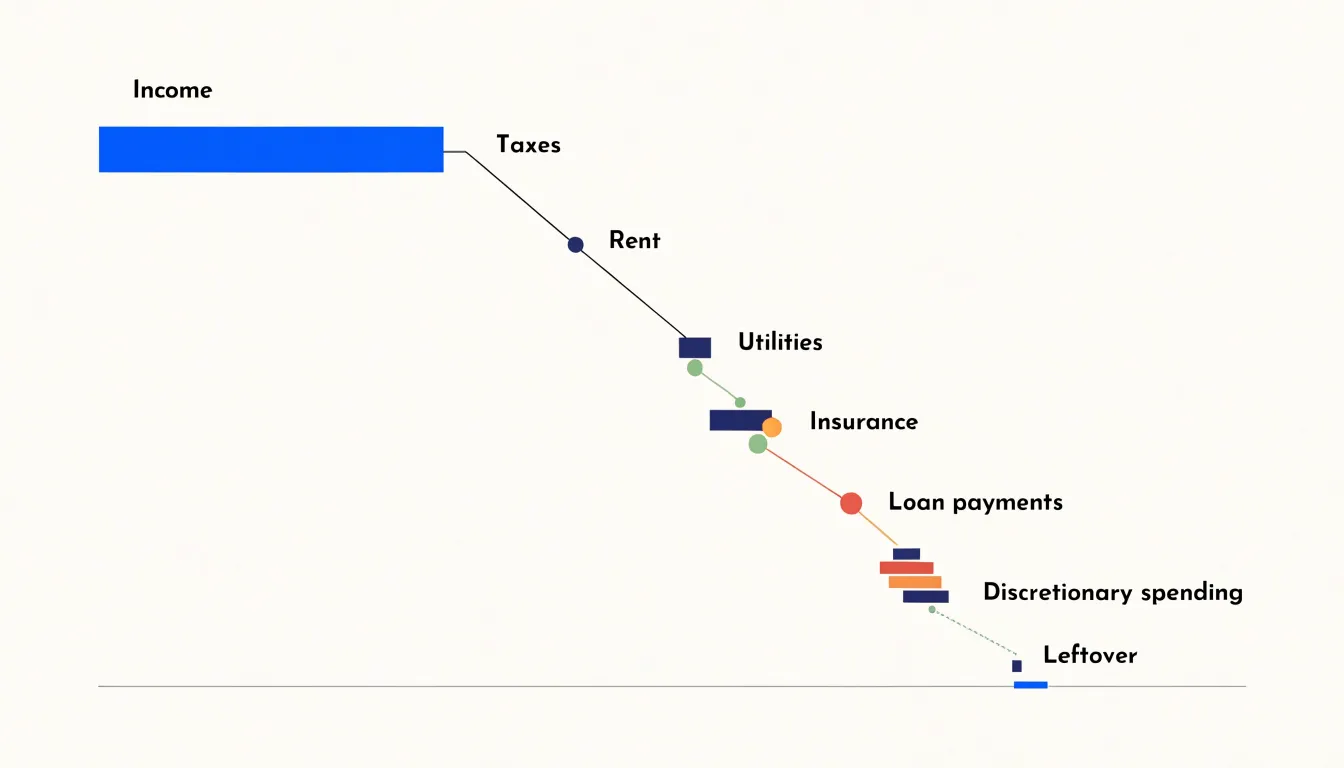
A waterfall chart turns the monthly budget into a visible journey from gross income to what remains. The chart begins with a tall bar representing total monthly income. From there, each expense appears as a floating bar that hangs below the previous running total, connected by thin lines that trace the descent. Federal and state taxes take the first bite, then fixed obligations such as rent or mortgage, utilities, insurance, and loan payments follow in sequence. Each bar is a negative addition, and the cumulative effect is a staircase that steps downward with every line item. The visual power lies in the order: you see exactly how much of the original income disappears at each stage. Discretionary purchases—dining out, subscriptions, entertainment—appear as smaller steps near the end, yet their collective impact becomes obvious as the final bar settles at the leftover amount. The waterfall makes the abstract arithmetic of a budget concrete: income is not a static number but a resource that erodes through a series of predictable claims. By arranging expenses from largest to smallest, or from mandatory to optional, the chart highlights where the biggest drops occur and how quickly the buffer shrinks. It also reveals the cumulative weight of small, repeated costs that might otherwise go unnoticed. For anyone trying to understand why money runs out before the month does, the waterfall chart provides a step-by-step narrative of depletion, turning a list of numbers into a clear story of cause and effect.
Donut Chart
A donut chart divides a budget into categories the same way a pie chart does, with one structural difference: the center is open. That open space can be used to display a single key metric in large type, such as total fixed costs, the monthly overhead figure, or fixed costs as a share of total spending. Because the eye is drawn first to the middle of the graphic, the number placed there becomes the starting point for reading the whole chart. Every ring segment around it is then interpreted in relation to that fixed anchor.
The surrounding rings carry the discretionary categories: travel, training, marketing spend, and other flexible line items. Their proportions remain visible as arcs of varying length, so a reader can still compare relative sizes at a glance. The key advantage is hierarchy. A standard pie chart gives every slice equal visual weight, which can let a large discretionary category compete for attention with the fixed costs that constrain the budget. In a donut chart with the center reserved for overhead, the fixed figure stays dominant while the flexible spending reads as a secondary layer orbiting it.
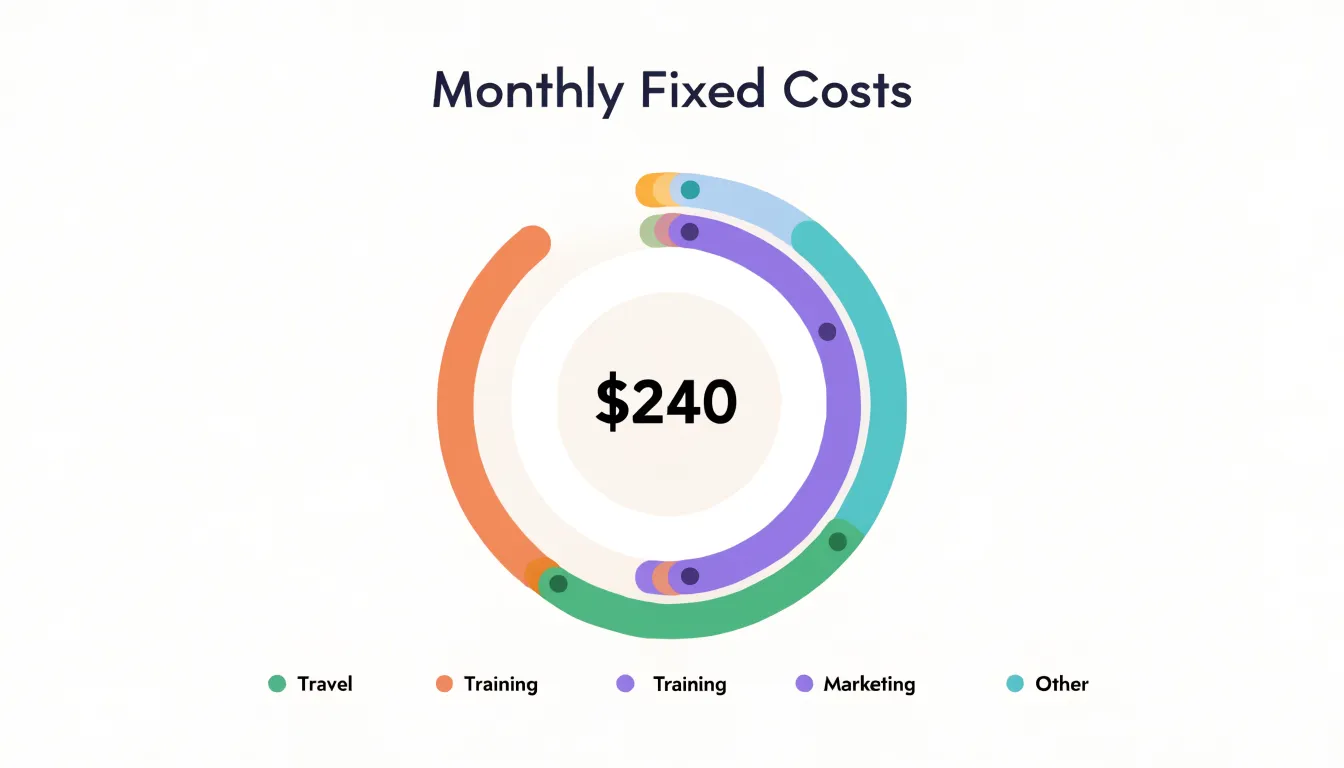
This arrangement works well in budget reviews where the central question is how much room remains for choices. A manager can glance at the hollow center, note the fixed commitment, and then scan the outer ring to see how the remaining funds are distributed. Grouping discretionary items into a few broad arcs keeps the ring legible, and consistent color coding across reporting periods lets readers track shifts in proportion without relearning the chart each time.
Labels should sit outside the ring or in a small legend, leaving the center uncluttered. When the fixed-cost figure is short, the chart reads clearly at a glance and supports quick comparison across departments or quarters.
Area Chart
An area chart works well for budget tracking when the question shifts from what happened in a given month to how much has built up over time. The chart plots values along a horizontal timeline, and the space between each trend line and the baseline is filled with a shaded region. Because that shading represents the running total, a savings line rising month after month produces an expanding band of color that makes accumulated progress visible at a glance. An outlay line treated the same way shows total spending to date, so the two shaded regions can be compared directly against one another across the full span of the chart.
The filled regions carry meaning that a plain line chart cannot convey on its own. When the savings band grows wider than the spending band at a given point on the timeline, the visual gap between them communicates the cushion a household or department has built. The crossover where the bands meet or overlap marks a moment worth investigating, such as a stretch of months where expenses outpaced deposits. Reviewers can trace the thickness of each band from left to right and follow the trajectory of accumulation through seasonal dips and one-off purchases.
Area charts also handle long horizons gracefully. Over twelve or twenty-four months, the shaded shapes take on a silhouette that summarizes the overall financial pattern, while individual months remain readable along the baseline. Using transparency for the fill lets both bands stay visible when the lines cross, and a consistent color scheme ties savings to one hue and outlay to another. Stacked variants can separate categories of expenditure beneath a single line, showing which spending streams contribute most to the cumulative total. This makes the area chart a strong choice for annual reviews, savings goal tracking, and any presentation where the audience needs to grasp total accumulation rather than isolated monthly figures.
Treemap
A treemap turns the full scope of a budget into a single screen of nested rectangles, where each rectangle’s area corresponds to a category or sub-expense’s share of the total. The largest block, whether it is housing, payroll, or inventory, occupies the most space and anchors the eye immediately. Within that block, smaller rectangles divide it into its component parts, so a parent category like utilities visibly breaks down into electricity, water, and internet without requiring a separate chart or table. This nesting can continue through several layers, letting a small business owner see a department, the line items inside it, and the specific vendors or services within each line item, all in one view.
What makes treemaps particularly useful for budgets is how they preserve proportion at every level. A sub-expense that consumes a disproportionate slice of its parent category appears as a noticeably larger rectangle within that block, drawing attention without any need for labels or annotations. Color can reinforce the hierarchy or flag overspending, and the compact layout means dozens of line items fit into a manageable visual field. For personal budgets with many recurring subscriptions and variable costs, or for small businesses juggling dozens of expense categories, this structure replaces long spreadsheets with an instant impression of where money is concentrated.
The hierarchical design also mirrors how budgets are naturally organized. Totals roll up from sub-expenses, categories contain subcategories, and the treemap reflects that same logic spatially. Users can scan the top level for overall balance, then drill into any block to examine the granular details behind it. This makes treemaps especially effective for spotting imbalances, comparing relative weights across categories, and communicating a complex budget to someone who needs the big picture at a glance.
Sankey Diagram
A Sankey diagram offers a powerful way to visualize how money physically moves through a household budget, tracing each dollar from the moment it arrives to the moment it is spent or saved. The chart uses flowing bands of varying width to represent the relative size of every cash flow, with wider streams showing larger dollar amounts and narrower streams showing smaller ones. Income sources such as a primary paycheck, a side gig, or freelance payments enter on the left side of the diagram as distinct streams. These streams then merge, split, and branch outward as they travel across the chart, eventually terminating in specific destinations on the right: individual bank accounts, dedicated savings goals, and recurring bill payments like rent, utilities, and loan installments.
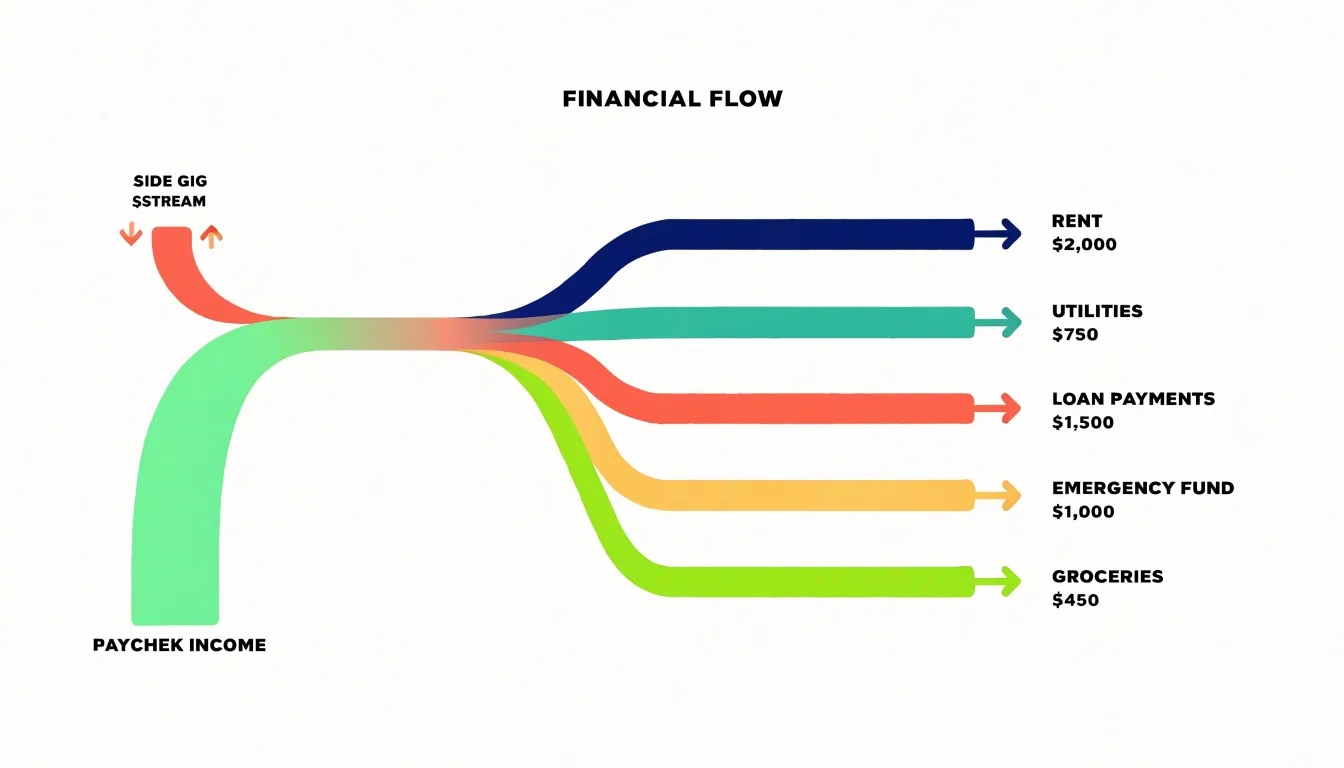
The fluid, directional nature of the diagram makes the movement of money intuitive. A reader can follow a single paycheck as it divides into a portion for rent, a portion routed to an emergency fund, and a portion allocated to groceries and daily expenses. Because the width of each band is proportional to the amount flowing through it, the visual weight of each branch immediately communicates which expenses and goals consume the largest share of income. Multiple income sources can be layered in from the left, letting viewers see how paycheck income and supplemental earnings combine before being distributed across the budget.
This layout transforms an abstract list of numbers into a clear picture of financial routing. It shows exactly where every dollar goes, revealing the full journey from earnings to obligations and savings targets. Households can use the diagram to confirm that income streams are fully accounted for, to spot destinations that receive disproportionate or unexpectedly small flows, and to understand at a glance how changes in income or spending would ripple through the entire budget structure.
Bullet Graph
A bullet graph packs a remarkable amount of budget information into a single compact horizontal bar. The bar itself represents current spending, while a small vertical marker sits at a defined point along the same axis to show the target goal for that category. Because both values share one scale, a reader can glance at the chart and immediately see how far apart actual spending and the planned figure are. When the bar stops short of the marker, spending sits comfortably within the pre-set threshold. When the bar extends past the marker, the overspend is visible at a glance without any mental arithmetic.
Behind the main bar, the bullet graph typically includes a small number of shaded bands that divide the axis into qualitative ranges. These bands might represent a comfortable zone, a caution zone, and an over-budget zone, each rendered in progressively darker shades. This layering gives the viewer context for the target marker, showing whether the goal sits near the edge of an acceptable range or comfortably inside it. A spending bar that creeps into a darker band signals trouble even before it reaches the target line, which helps budget owners catch drift early.
The compactness of the bullet graph makes it well suited to dashboards where dozens of budget categories appear side by side. Each row occupies only a narrow strip of vertical space, yet still carries the current value, the comparative target, and the qualitative thresholds. Labels usually sit to the left of each bar, listing the category and its figures, so a full budget review can happen in a single screen view. Readers scanning down the column of bars can spot outliers quickly and then focus their attention on the categories that need adjustment.
Dual Axis Chart
A dual axis chart pairs two different measures on a single shared horizontal timeline while giving each measure its own vertical scale. In a budget context, the left Y-axis carries monthly income, which may swing widely from month to month for freelancers, commission earners, or seasonal workers, and the right Y-axis carries total monthly expenses, which tend to stay comparatively steady. Plotting both as lines or as a line and a column set across the same twelve-month span lets the reader see, at a glance, where the two curves cross, converge, and separate. During lucrative months the income line climbs well above the expense line, and the vertical gap between them represents available margin that can be routed to savings, debt reduction, or irregular costs. During lean months the income line dips toward or below the expense line, and that same gap, now inverted, shows how much of the reserve needs to be drawn down or how much shortfall must be covered. Because the two axes are independent, income and expenses can each be scaled to fill the plot area, keeping both trends legible even when their absolute values differ by an order of magnitude. The chart works best when the horizontal axis is time and the data is monthly, since the reader is tracking rhythm and repetition rather than a single snapshot. Care is needed in labeling both axes clearly and in choosing colors that distinguish the two series without implying that one causes the other. Used this way, the dual axis view turns a budget from a static list of categories into a picture of financial breathing room across the year.
Seasonal Spending Views
Seasonal spending views overlay a calendar onto a budget chart so that recurring annual patterns become visible at a glance. Many households spend in ways that repeat year after year: December gift purchases push spending well above the monthly average, summer months bring travel and higher utility bills, and late August or early September carries back-to-school costs for families with children. A standard monthly budget chart flattens these variations, treating a heavy December as an anomaly rather than a predictable event. A seasonal view corrects for this by highlighting the same months across multiple years, letting a predictable surge stand out from genuine one-off expenses. These overlays typically take the form of shaded bands, color-coded month markers, or comparison lines that align the current year against prior years on the same month axis. The visual result is a chart where December, July, and September glow as known pressure points rather than surprises. This helps with planning because the surges can be anticipated and funded in advance through sinking funds or adjusted monthly allocations. Spotting the spikes also supports better decisions about timing large purchases, scheduling travel, or setting aside money during quieter months. When the seasonal pattern is visible, a budget becomes a forward-looking tool keyed to the rhythm of the year, and the conversation shifts from reacting to overspending toward preparing for expenses that arrive on a dependable schedule.
Shareable Family Dashboards
A shared family dashboard turns abstract budget numbers into a visible, everyday reference point that everyone in the household can see and understand. When key financial charts live in one central place, whether that is a tablet mounted in the kitchen, a shared cloud document, or a family app, the budget stops being a private spreadsheet known to one person and becomes a common language for the whole household. Each chart carries a specific job: a pie chart breaking down spending by category shows where money actually goes, a bar chart comparing planned versus actual outlays reveals where the family is drifting, and a progress gauge tracking savings toward a shared goal such as a holiday or a new appliance gives the numbers a purpose everyone can rally behind.
The value of centralizing these visuals lies in the conversations they prompt. Instead of one person announcing restrictions, the charts invite questions and joint decisions. A teenager can see the entertainment slice shrink as the family redirects funds toward a trip. A partner can spot an unexpected utility spike and raise it early rather than discovering it at month end. These small, regular check-ins build financial transparency and reduce the friction that comes from hidden spending or unclear priorities.
Collective goal tracking strengthens the effect. When savings milestones appear on a shared screen, progress becomes tangible and shared effort feels worthwhile. Children learn basic budgeting concepts by watching charts update in real time, and adults stay accountable to commitments made in front of the whole family. Placing these dashboards where they are genuinely seen, and updating them on a predictable schedule, keeps the household aligned and turns budgeting into a collaborative routine rather than a solitary chore.
Interactive Budget Reports
Interactive budget reports turn a static summary into a navigable window onto your finances. When a chart shows total spending by category, the value of that view lies in what sits behind each bar or slice. Dynamic filtering lets a user narrow the picture in real time by choosing a date range, a category, an account, or a transaction type, and the chart updates instantly to reflect only those transactions. A household reviewing its grocery budget can isolate the last three months, compare them against the same period a year earlier, and then filter further to a single store or payment method. Each adjustment recalculates the totals and redraws the visualization, so the report behaves like a conversation with the data rather than a fixed snapshot.
Drill-down capabilities extend this by letting users click directly into a chart element to reveal the individual transactions that make up the aggregate. Selecting a large slice for dining out opens a list of every restaurant charge within that category, complete with dates, amounts, and merchants. From there a user can sort by size to spot the outlier that pushed the total higher, or filter by date to confirm whether spending clustered around a particular week. Successive levels of detail allow movement from an annual overview down to monthly, weekly, and finally single transactions, with each step preserving the context of the level above.
This combination of filtering and drill-down supports practical budget decisions. A user can verify that a category total matches expectations by inspecting the underlying entries, question a recurring charge that appears repeatedly, or identify a merchant where small purchases accumulate into a significant sum. Interactive reports also reduce the need for separate spreadsheets or manual cross-referencing, since the explanation for any number on the chart is one click away. The result is a transparent budget review in which every summary can be traced to its source.
Frequently Asked Questions
What is a good chart for comparing spending across budget categories?
A bar chart turns a monthly budget into comparable columns or rows, so the relative height or length of each bar communicates the size of that expense without requiring you to read numbers. Its shared baseline keeps comparisons honest and intuitive.
How can I track budget spending trends over time?
A line graph excels at tracking spending trends over time by connecting continuous data points, such as monthly or quarterly expenses, into a clear visual narrative. Its peaks and valleys make seasonal fluctuations and long-term habits easier to spot.
What chart shows how income is reduced by expenses until money is left over?
A waterfall chart begins with total monthly income, then shows each expense as a floating bar below the previous running total, creating a staircase that steps downward to the leftover amount. It highlights where the biggest drops occur and reveals the cumulative weight of small, repeated costs.
How can I see where every dollar goes from income to savings and bills?
A Sankey diagram uses flowing bands whose width represents the relative size of each cash flow, tracing income sources on the left to accounts, savings goals, and recurring bills on the right. It shows the full journey from earnings to obligations and savings targets.
What chart can highlight fixed costs while showing discretionary spending around them?
A donut chart uses its open center to display a single key metric, such as total fixed costs or monthly overhead, while the surrounding rings carry discretionary categories. This keeps the fixed figure dominant while flexible spending reads as a secondary layer.
How can I spot predictable seasonal spending spikes in my budget?
Seasonal spending views overlay a calendar onto a budget chart so recurring annual patterns, such as December gift purchases, summer travel, and back-to-school costs, become visible. This helps anticipate surges and fund them in advance through sinking funds or adjusted monthly allocations.
Tony Astor
Tony writes about data visualization and the tools people use to build charts and dashboards. More about Data Illustrator