Bar Chart vs Pie Chart: Which Shows Your Data Better?
 By Tony Astor ·

Bar Chart vs Pie Chart
A bar chart compares quantities across categories using bar length on a common zero baseline, making differences and rankings easy to judge precisely. A pie chart shows each category’s share of a single whole as slices of a circle, best for part-to-whole relationships with roughly five to seven categories. Use bars for comparison, pies for proportions.
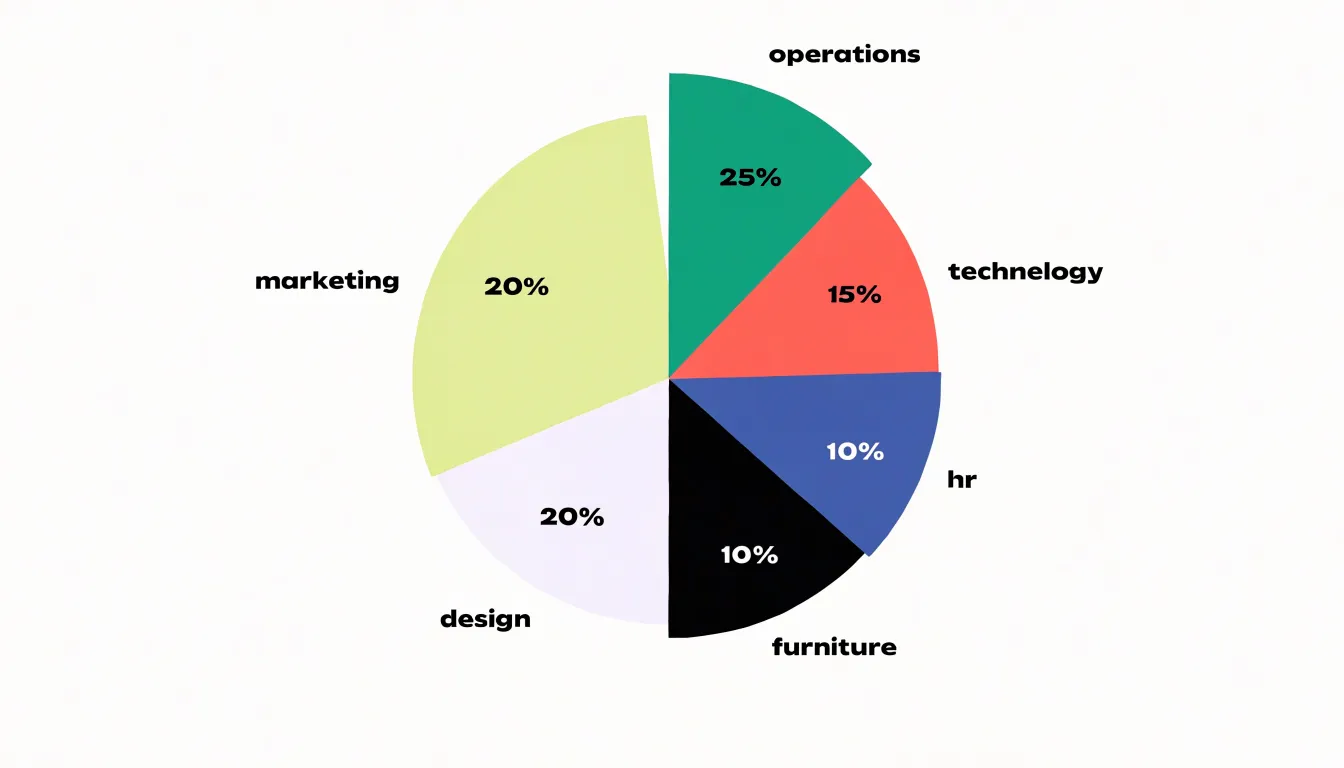
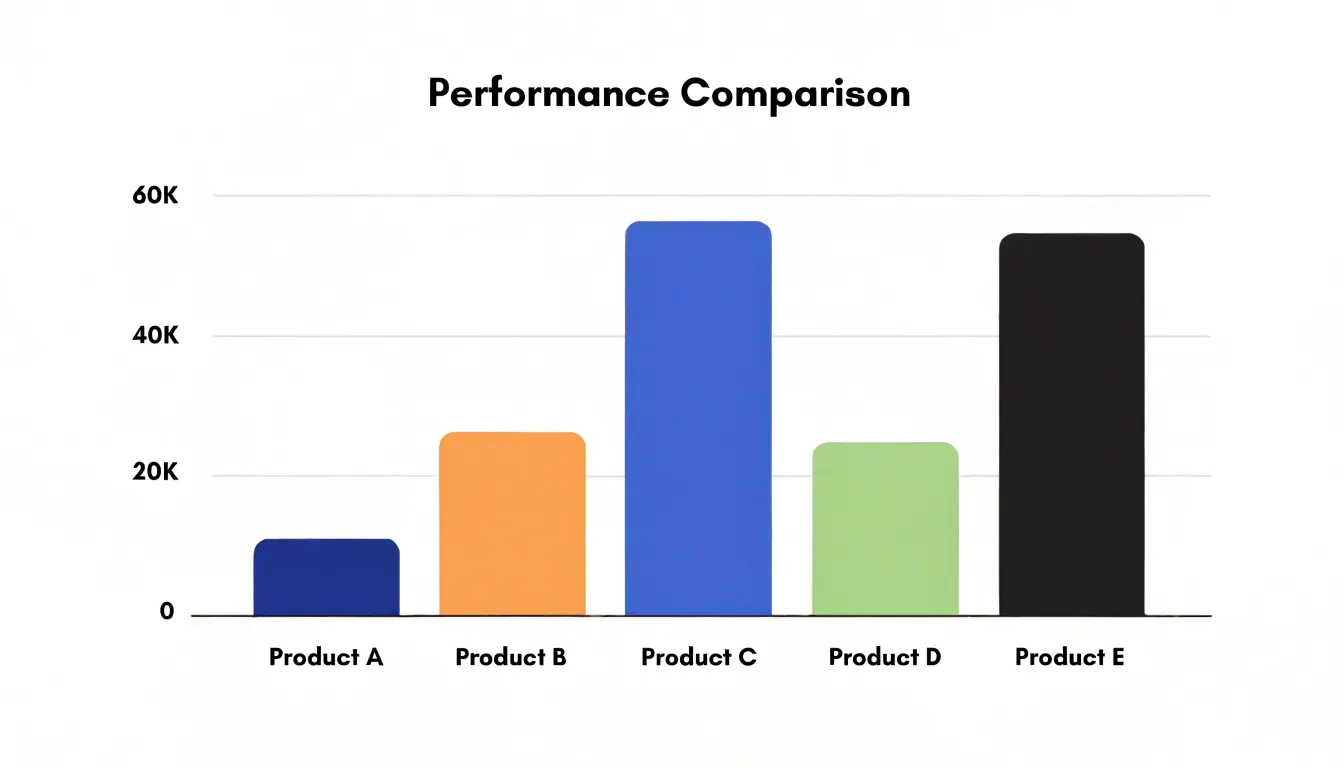
Table of Contents
Bar Chart
Bar charts compare quantities across distinct categories. Each category is represented by a separate bar whose length or height encodes its value. Because the bars align along a common baseline, differences in magnitude are immediately visible: a longer bar indicates a larger value, and the relative lengths of two bars directly reflect the ratio between their quantities.
This format works particularly well for discrete, non-continuous data—such as item counts across groups, survey responses by category, or sales figures for different products—where there is no natural ordering or continuous scale between categories. A bar chart compares these values without implying any interpolation between points.
The categorical axis can be arranged alphabetically, by value, or by logical grouping to aid comparison. Readers can also quickly extract values by reading the axis or direct data labels.
Pie Chart
A pie chart displays data as a circular graph divided into slices, where each slice represents a category’s proportion of a single total. The entire 360-degree circle corresponds to 100 percent, and each slice’s angle is calculated by multiplying the category’s percentage by 360 degrees. This direct mapping shows part-to-whole relationships—such as budget allocation, market share, or survey responses—allowing viewers to see at a glance which categories dominate and which are minor.
However, pie charts have limitations:
- Perceptual limits: Human perception is better at comparing lengths than angles, making precise comparisons between similarly sized slices difficult.
- Clutter: They work best with five to seven categories; too many slices clutter the chart, obscure subtle differences, and cramp labels.
- Data constraints: They cannot easily accommodate negative values or categories that do not sum to a meaningful whole.
Bar Chart
Pairing visual length with a labeled numerical y-axis and evenly spaced gridlines turns a bar chart into a tool for extracting exact data points. A viewer can trace a horizontal line from a bar’s top edge to the axis to read off a figure with high confidence.
Gridlines act as visual reference markers, breaking the chart’s space into regular intervals. Rather than estimating against an unmarked background, the viewer can count intervals and interpolate fractional distances between them. Including both major and minor gridlines improves precision further, supporting readings down to small increments.
This precision matters in annual reports, scientific publications, and operational dashboards where audiences must verify thresholds or extract figures for their own calculations without consulting a separate data table. Careful axis labeling, consistent tick spacing, and gridlines that do not overpower the bars make these exact values accessible.
Pie Chart
Because a pie chart’s 360-degree circle serves as a built-in reference point for 100 percent, readers can interpret the data immediately without needing axes, scales, or unit labels. The eye naturally catches the largest wedge first, making dominance obvious without calculation. Furthermore, slices spanning a quarter or half of the circle match familiar everyday shapes like a clock face or a sliced cake, keeping cognitive load low.
This familiarity makes pie charts effective for communicating a simple percentage breakdown to a broad audience—including readers uncomfortable with dense tables—on presentation slides, infographics, or report summaries with minimal supporting text. While the format sacrifices some precision, it trades it for speed and accessibility when the priority is a quick, memorable impression of how a total divides.
Bar Chart
Bar charts scale well to datasets with dozens of categories—such as product lines, survey options, or regional segments—because they allocate space linearly along an axis. Each additional category simply extends the chart’s length or height: the chart grows in one dimension while the quantitative axis remains fixed.
While a wide vertical layout can accommodate many variables, a horizontal bar layout is often preferred when categories are numerous or have long names. Because each bar occupies its own row, text labels do not need to be rotated or truncated, allowing the viewer to scan from top to bottom without overlapping text. For very large datasets, sorting bars by value transforms the chart into a ranked list that makes patterns immediately apparent.
Pie Chart
When a dataset has more than five to seven categories, grouping minor data points into an ‘Other’ category keeps a pie chart readable and prevents tiny segments from obscuring the main message.
- Sort the data from largest to smallest.
- Identify a threshold for minor contributors—often, slices representing less than 5% of the total are candidates for grouping.
- Combine these minor categories into a single ‘Other’ slice placed at the end of the pie, typically in a neutral color like gray to distinguish it from main categories.
- Include a note or tooltip explaining what ‘Other’ comprises to keep the chart transparent.
Reducing the slice count this way also makes it easier to assign distinct, recognizable colors and apply clear labels directly on the slices or in a legend.
Bar Chart
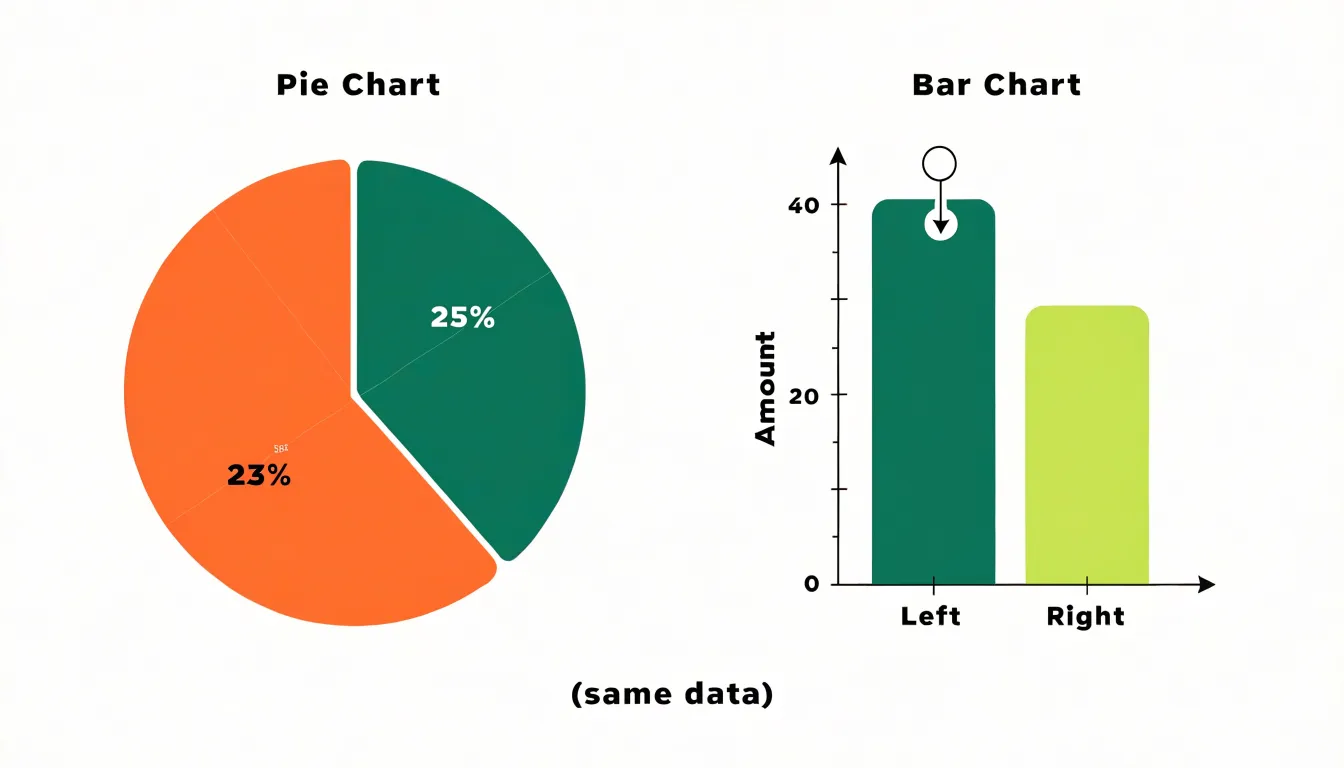
Position along a common linear scale is one of the most accurate visual encodings available. When two values differ by only a few percentage points, the corresponding bars differ by a few pixels of height along a single axis. Viewers can align the tops of adjacent bars against an imaginary baseline to judge which is taller and estimate the gap. A bar representing 47 units sits visibly below one representing 52 units, and that five-unit gap remains legible even when the chart is small or the bars sit far apart on the page.
In a pie chart, by contrast, comparing two similar angles or wedge shapes sitting at different orientations around a circle taxes human perception, especially when slices are separated by other slices or their edges curve away from one another. Two wedges of 23 and 25 percent look nearly identical, whereas the equivalent bars show a clear, measurable step. Consequently, bar charts better suit datasets where fine distinctions matter, such as rankings with close scores, year-over-year changes of a few percent, and budget categories that hover near one another.
Bar Chart
When a bar chart’s horizontal axis is organized around chronological units—days, weeks, months, quarters, or years—viewers can scan from left to right to read change across time. A rising series of bars signals growth, a falling series signals decline, and a flat run of similar heights signals stability.
This chronological framework also highlights seasonal rhythms and long-term trajectories. Placing twelve monthly bars side by side reveals recurring peaks and dips, such as retail sales spiking every December, energy consumption climbing each summer, or staffing needs dipping during holidays. Similarly, lining up yearly bars simplifies multi-year comparisons.
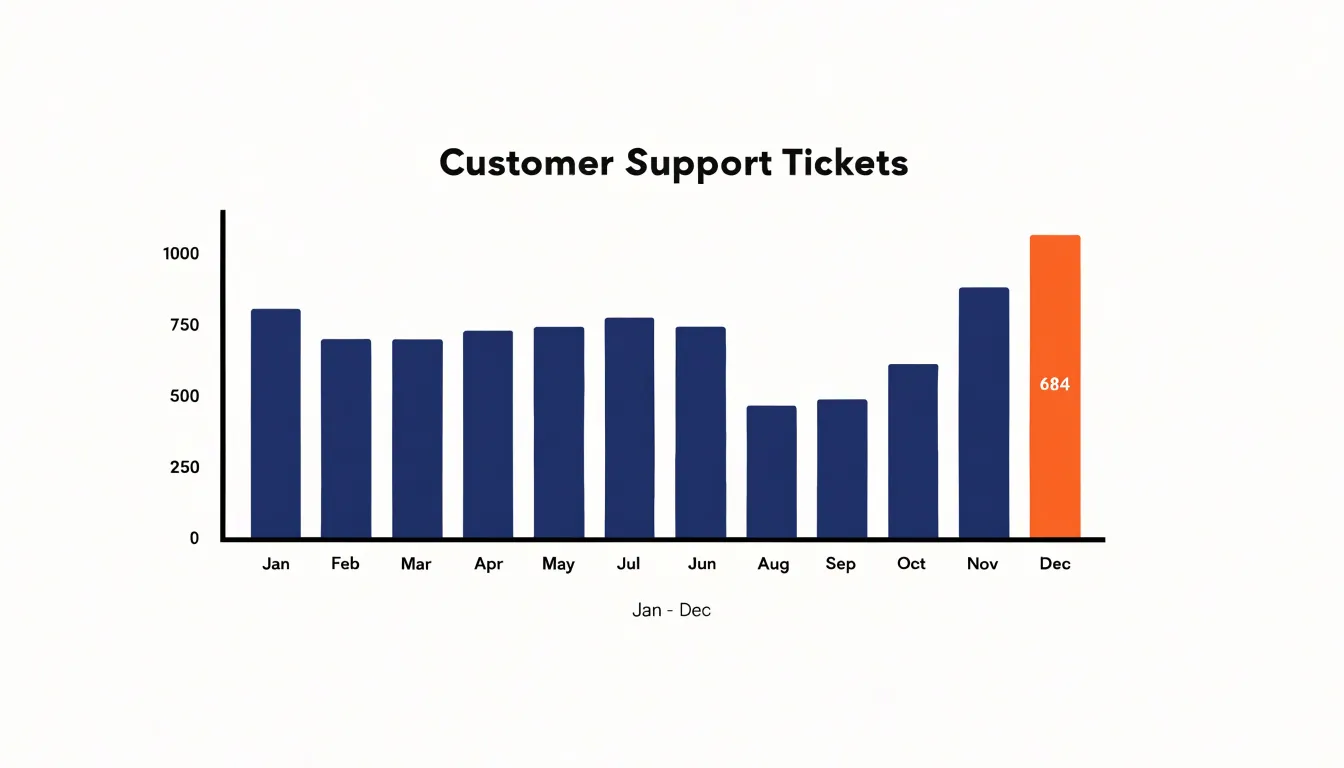
To keep the time narrative intact, order categories chronologically, maintain consistent bar widths and spacing, and label the axis clearly with dates or periods. When data are dense, grouping or stacking bars by sub-category allows readers to track several time series at once while still seeing the overall pattern.
Grouped Bar Chart
A grouped bar chart adds a second dimension to the standard bar chart by placing bars side by side in clusters on a shared baseline. Each cluster represents a primary category (such as a region, product line, or time period), while individual bars within the cluster represent secondary sub-categories (such as quarterly results, demographic segments, or survey responses), distinguished by color or shading and anchored by a legend.
This layout supports a dual reading path: the eye can compare sub-categories within a single cluster, or compare the same sub-category across different clusters. For example, a sales report might use quarters as clusters and sales channels as individual bars, showing both which channel leads in a given quarter and how each channel performs across the year. Grouped bars also work well for before-and-after comparisons using two bars per cluster.
Because bars narrow and visual grouping weakens as clusters grow beyond three or four bars, designers often limit sub-categories or switch to small multiples for larger counts. Spacing between clusters should remain visibly larger than spacing within them to signal which bars belong together.
Donut Chart
A donut chart opens up the middle of a pie chart, replacing the solid disk with a ring of proportional segments. Because the segments still share a common center and sweep equal radii, each slice’s arc length still corresponds directly to its share of the whole, but the structural change offers three practical benefits:
- Reduced crowding: Clearing the center removes the tightest part of the pie where narrow slices cluster and become hardest to read, giving every category a more even share of the visible outer band.
- Space for summary data: The hollow center creates a focal point that can hold a headline figure—such as a total count, an average, a percentage, or the chart’s title—allowing the graphic to show overall magnitude and category breakdown at once without a separate text block.
- Lighter visual weight: The central white space and uniform band width give the chart a cleaner, more contemporary appearance that fits well in multi-chart dashboards and reports.
Bar Chart
Because readers judge magnitude from the area and height of bars rather than from tick labels, a bar chart’s value axis must start at zero so every bar’s length remains proportional to the quantity it encodes. Truncating the axis—for example, starting the scale at 90 instead of zero—breaks this relationship, making a two- or three-unit difference appear as a dramatic gap and making the shorter bar look negligible. This distortion is especially risky when decisions rest on perceived gaps in quarterly sales, survey responses, or team performance.
A non-zero baseline is defensible only in limited situations, such as tracking a narrow range around a meaningful threshold, and even then the axis break must be clearly marked and the trade-off acknowledged. In most business and editorial contexts, a zero baseline, consistent tick intervals, and a clear axis label are essential to keep visual proportions faithful to the numbers.
Pie Chart
Rendering a pie chart in three dimensions tilts the circular face into an ellipse, compressing the vertical dimension of the chart unevenly. Slices near the top or bottom are foreshortened more than those at the left and right edges, while perspective makes the near front edge appear larger and more prominent than the shrinking back edge.
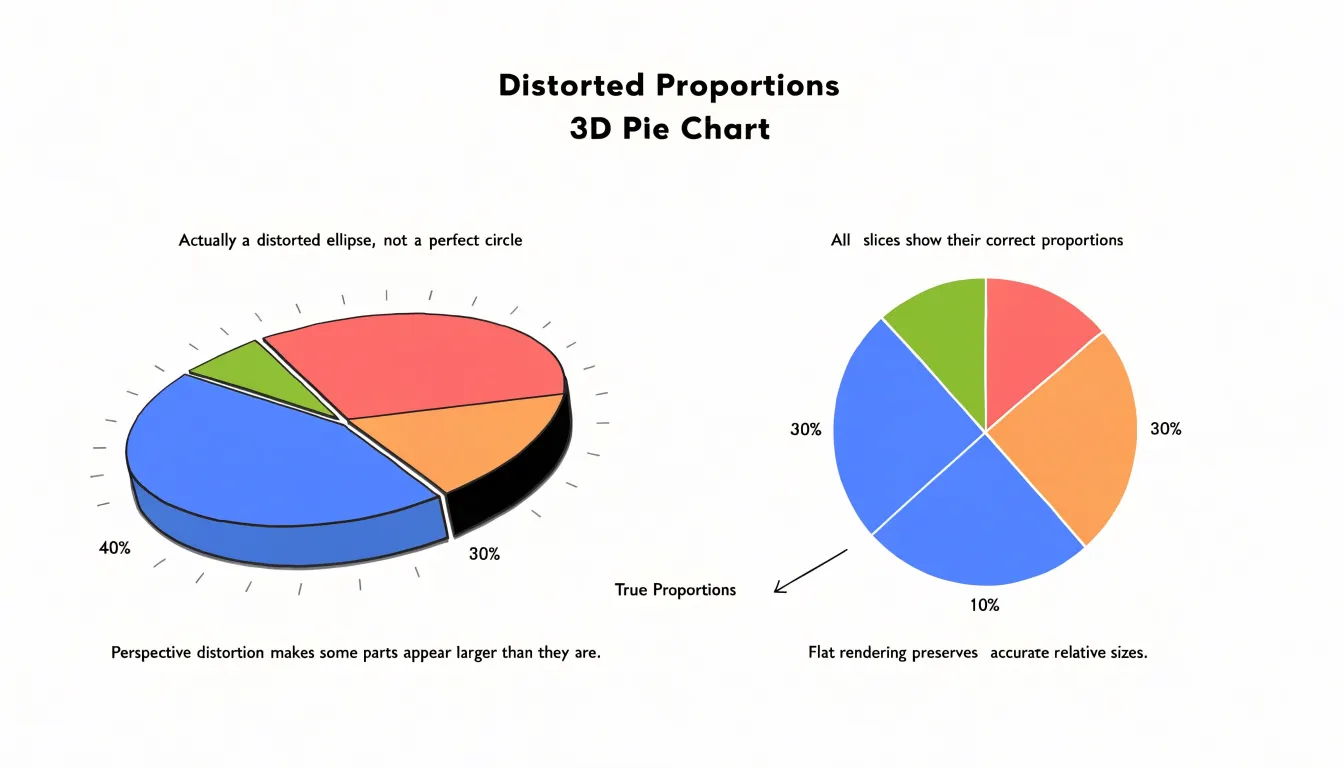
Because readers compare visible areas rather than underlying numbers, even a slight tilt of a few degrees distorts perceived proportions: a 25 percent slice at the front or top/bottom may look smaller than a 15 percent slice at the side, changing a reader’s conclusion about which category leads. The shadow and depth cues accompanying 3D effects further distract from the data. Keeping a pie chart flat and two-dimensional is a requirement for accurate communication, ensuring every slice’s angle and area map directly to its share of the total.
Chart Choice
Choosing between a bar chart and a pie chart depends on three factors:
- Audience analytical depth: Specialists who routinely work with data often expect to compare exact values across many categories on a bar chart’s axis, whereas a general audience may respond better to a pie chart showing simple proportions across a few slices.
- Narrative goals: Stories about ranking, growth, or differences between categories rely on bar length and position; stories about how parts form a whole belong in a pie chart.
- Communication priorities: Available viewing time, display medium (projected screen versus printed report), dense category counts, long labels, and subtle differences favor bars, while quick impressions of two to four simple shares favor pies.
Dashboard
Compact dashboard layouts require matching each chart to its available footprint and removing unnecessary decoration:
- Orientation and placement: Use horizontal bars in narrow panels to fit category labels without crowding, and keep bars pointing in the same direction across a row of widgets for consistent scanning. Reserve pie charts for a single summary position, limited to three to five pronounced slices so they remain legible at small sizes.
- Aspect ratios: Allocate sufficient width to bar-based widgets—squeezing a bar chart into a square panel obscures length differences—and keep pie charts roughly circular.
- Decluttering: Remove gridlines, redundant legends, and heavy borders to free space for data. Label series directly so viewers do not have to match colors to a key, and apply colors consistently across the dashboard to tie related metrics together.
Frequently Asked Questions
When should I use a bar chart instead of a pie chart?
It depends on audience analytical depth, narrative goals, and communication priorities. Bar charts suit ranking, growth, differences between categories, exact value comparison, and subtle distinctions. Pie charts suit simple part-to-whole proportions across a few slices.
What are the limitations of pie charts?
Pie charts can make precise comparisons between similarly sized slices difficult because people compare lengths better than angles, and they work best with five to seven categories. They also cannot easily accommodate negative values or categories that do not sum to a meaningful whole.
Why should a bar chart’s value axis start at zero?
A bar chart’s value axis should start at zero so every bar’s length stays proportional to the quantity it encodes; truncating the axis can make small differences look like dramatic gaps. A non-zero baseline is defensible only in limited situations, such as tracking a narrow range around a meaningful threshold, and even then the axis break must be clearly marked and the trade-off acknowledged.
How many categories should a pie chart have?
Pie charts work best with five to seven categories; with more, grouping minor data points into an “Other” category keeps the chart readable. Often slices representing less than 5% are candidates, and the “Other” slice is placed at the end, typically in a neutral color like gray, with a note or tooltip explaining what it comprises.
What is wrong with 3D pie charts?
Rendering a pie chart in 3D tilts the circular face into an ellipse, compressing the vertical dimension unevenly and making slices near the top or bottom foreshortened more than those at the left and right. Because readers compare visible areas, even a slight tilt can distort perceived proportions; keeping a pie chart flat and two-dimensional is a requirement for accurate communication.
How can I make exact values easier to read in a bar chart?
Pair visual length with a labeled numerical y-axis and evenly spaced gridlines so viewers can trace from a bar’s top edge to the axis and read a figure with high confidence. Major and minor gridlines improve precision, and careful axis labeling plus consistent tick spacing help make exact values accessible.
Tony Astor
Tony writes about data visualization and the tools people use to build charts and dashboards. More about Data Illustrator