Bar Chart vs Column Chart: Which Should You Use?
 By Tony Astor ·
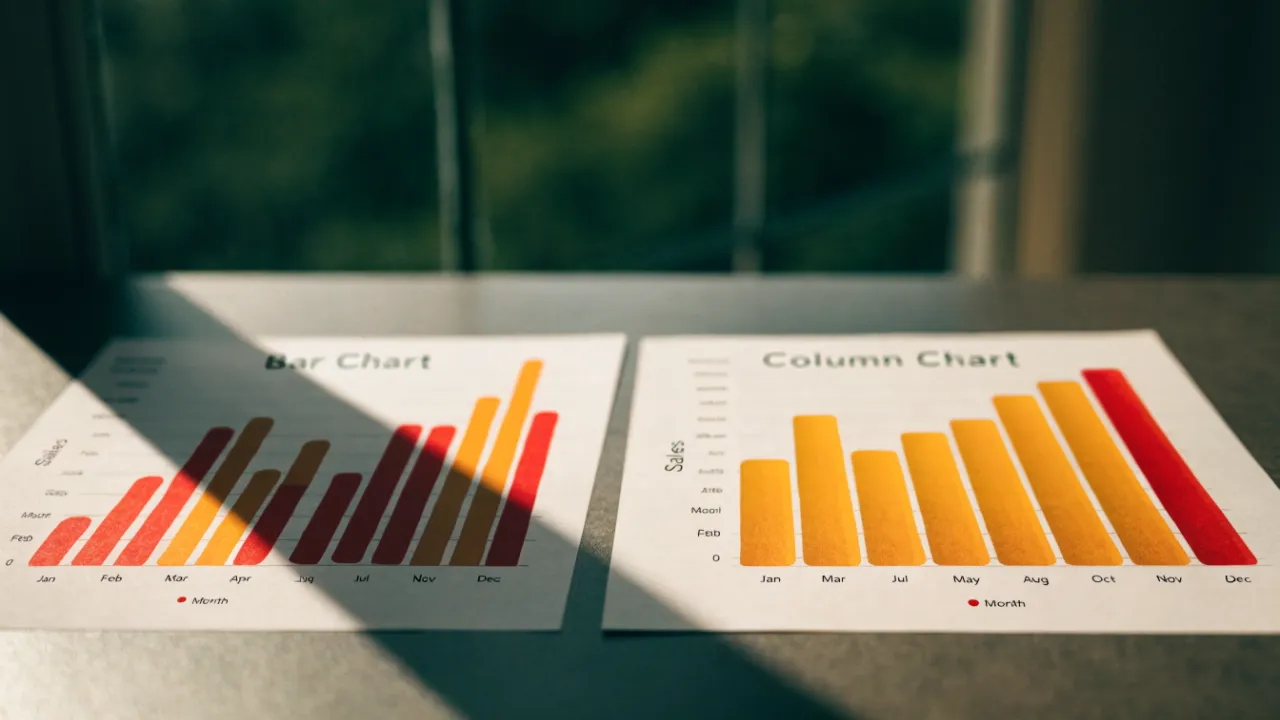
Bar Chart vs Column Chart
Horizontal bar charts are best for long category labels and ranking many items, because labels read left to right without rotation and bars share a common baseline. Column charts suit time-series data and short labels, since categories run left to right along the horizontal axis in natural reading order.
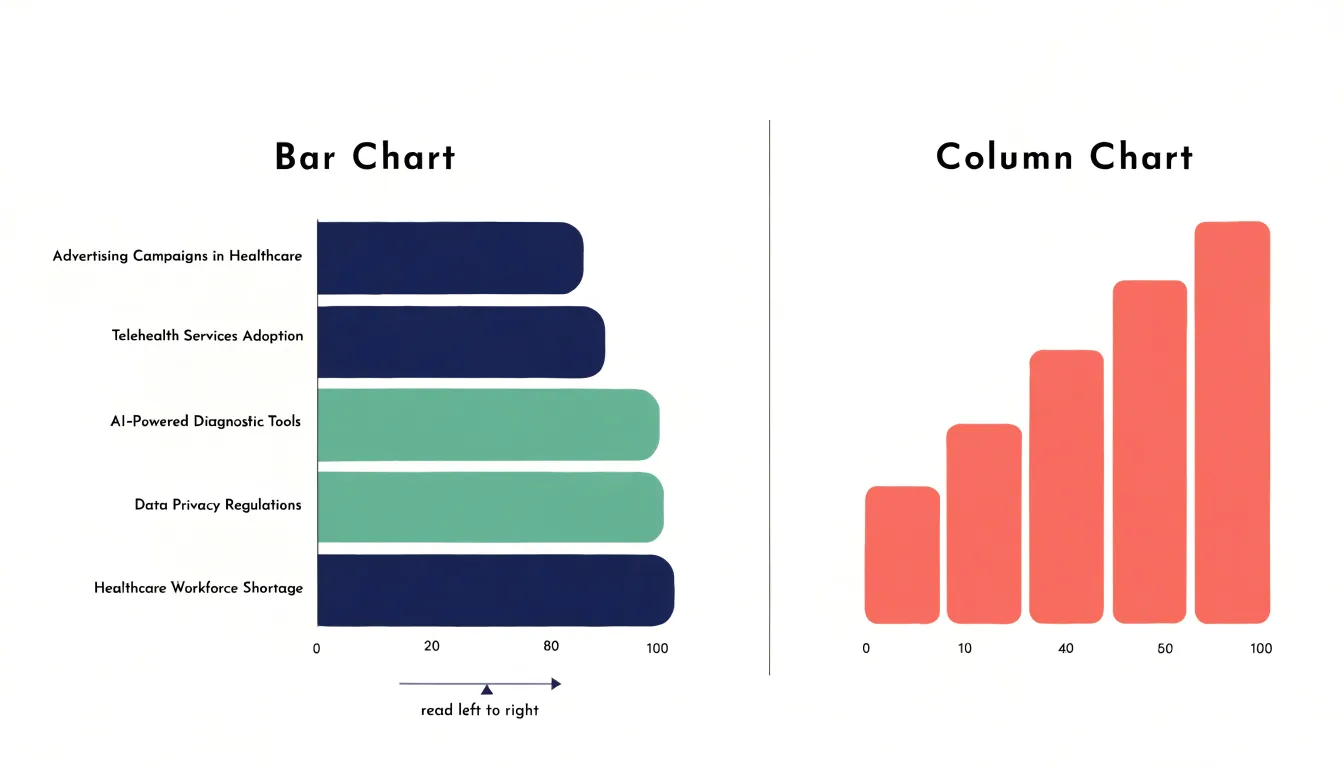
Table of Contents
Bar Chart
When category labels are long, horizontal bar charts offer a distinct advantage by accommodating text naturally along the vertical axis. Each bar extends horizontally, and its corresponding label sits to the left, read from left to right without rotation. This layout provides ample space for lengthy descriptions, such as full product names, survey questions, or geographic locations, because the label area can expand vertically as needed. Unlike vertical column charts, where long labels must be angled diagonally or stacked vertically to avoid overlap, horizontal bars keep text upright and legible. The result is a clean, uncrowded appearance that reduces cognitive load for the viewer. Readers can scan the labels quickly and compare bar lengths without tilting their heads or deciphering slanted text. This makes horizontal bar charts particularly effective for communicating with audiences who need to grasp detailed category information at a glance. The natural reading direction of most languages aligns with horizontal text, so labels remain instantly accessible. Moreover, the vertical arrangement of categories allows for a logical ordering, such as alphabetical or by value, without compromising label readability. In reports and dashboards where space is limited, horizontal bar charts make efficient use of the horizontal dimension for bars while dedicating the vertical dimension to text. This separation of concerns—text on one axis, quantitative length on the other—creates a balanced and professional visual. By avoiding the need for diagonal or vertical text alignment, horizontal bar charts ensure that every label is presented clearly and uniformly, enhancing both comprehension and aesthetic appeal.
Column Chart
A column chart places its categories along the horizontal axis and its values along the vertical axis, which means time-based data reads in the same direction that people naturally scan a page: from left to right. When each column represents a discrete period such as a day, week, month, or quarter, the sequence of columns becomes a visual timeline. The earliest period sits at the far left, the most recent at the far right, and the reader’s eye follows the progression in the expected order without needing to consult the axis labels closely. This horizontal cadence mirrors the way calendars, timelines, and written text are arranged, so the chart feels immediately legible.
The vertical height of each column then carries the quantitative message. Taller columns signal larger values and shorter columns signal smaller ones, giving readers a quick sense of direction and magnitude as they move across the chart. A rising series of columns communicates growth, a falling series communicates decline, and an uneven series draws attention to volatility or seasonality. Because height differences are easy to compare side by side, column charts help viewers spot turning points, peaks, and troughs across consecutive periods.
The spacing between columns reinforces the idea of distinct, countable intervals. Each gap marks a boundary between one period and the next, which suits data recorded in fixed increments rather than continuous measurements. This makes column charts well suited to reporting monthly sales, quarterly revenue, weekly traffic, or annual output, where each bar stands for a self-contained slice of time. The combination of left-to-right ordering and clear vertical comparison gives column charts a natural fit for trend analysis across discrete time periods.
Layout Differences
The physical layout of a chart directs the reader’s eye along specific paths, and the orientation of bars fundamentally changes that path. When bars extend horizontally, the eye travels left to right, following the natural reading direction in many Western cultures. This horizontal flow aligns with how we scan text and may reduce cognitive effort when comparing lengths. The categorical labels sit along the vertical axis, often at the left, allowing quick association between label and bar without shifting gaze far. In contrast, vertical columns guide the eye upward and downward. This vertical flow can feel less natural for reading sequences but excels when categories are ordered along the horizontal axis, such as time periods. The eye moves from the base of each column to its top, comparing heights in a sweep that mimics scanning a skyline. Spatial axis placement further shapes comprehension. With horizontal bars, the quantitative scale runs along the bottom, providing a consistent baseline for length judgments. The categorical axis on the left acts as a stable reference, so comparing bars involves minimal eye movement between label and value. With vertical columns, the quantitative scale is on the left, and the categorical axis is at the bottom. This arrangement can make it harder to link a column to its category, as the eye must travel down to read the label and back up to assess the height. The resulting eye-tracking patterns show more fixations and regressions for vertical layouts when categories are numerous or labels are long. These layout differences influence how quickly and accurately viewers extract meaning, making orientation a key consideration in chart design.
Long Labels
Horizontal bar charts offer a distinct advantage when category labels are long, because the text runs horizontally along the y-axis, matching the natural reading direction. This alignment allows each label to occupy a single line, extending outward as needed without forcing the viewer to tilt their head or decipher rotated text. In contrast, vertical column charts place category labels along the x-axis, where horizontal space is limited by the width of each column. When a label exceeds that width, the charting software must either wrap the text onto multiple lines, shrink the font to an illegible size, or rotate the label to a steep angle. Wrapping introduces awkward breaks that can split words or phrases in confusing ways, while rotation slows reading and increases cognitive load. Horizontal bars eliminate these problems entirely: labels remain upright, fully legible, and easy to scan from top to bottom. This design also preserves report margins. In a column chart, long labels often force the plot area to expand horizontally, pushing against page boundaries or requiring the entire chart to be scaled down, which reduces the space available for the data itself. With horizontal bars, the labels occupy the left margin, and the plot area can be sized independently. The result is a clean, professional layout that respects the document’s width constraints and keeps the focus on the data. For reports with descriptive category names—such as survey responses, product names, or geographic regions—horizontal bars ensure that text remains readable and the overall composition stays balanced.
Time Series
Vertical columns offer a clear and intuitive way to display chronological sequences, particularly when the audience needs to compare values across regular intervals such as months, quarters, or years. The vertical orientation places time along the horizontal axis, moving from left to right in the direction the eye naturally reads, while the height of each column encodes the magnitude of the value. This layout makes monthly sales figures easy to scan and lets readers spot seasonal patterns, sudden spikes, or gradual declines without needing to interpret complex legends or overlays.
A few practices help vertical columns perform well in time series work. Keep the intervals evenly spaced so that the distance between columns reflects equal units of time; uneven spacing can distort the reader’s perception of pace and trend. Start the value axis at zero whenever possible, since truncated axes exaggerate differences between adjacent columns and can mislead viewers about the scale of change. Label the time axis directly with recognizable period names rather than codes, and rotate labels only when necessary to preserve readability. When a series contains many periods, consider thinning labels or grouping them into quarters or years to avoid crowding beneath the columns.
Color and annotation also support interpretation. A single consistent color keeps attention on the trend, while a contrasting highlight can call out a milestone such as a record sales month or a year of exceptional growth. Adding a subtle trend line or a short caption beneath key columns can reinforce the story the data tells. Used with these safeguards, vertical columns turn chronological data into a readable narrative of change over time.
Ranking Categories
When the goal is to communicate ranking among categories, the order in which those categories appear matters as much as the values themselves. A horizontal bar chart offers a natural home for this kind of presentation because the bars extend left to right, and the eye travels along that axis in a predictable sequence. Sorting the categories from highest to lowest value turns the chart into a leaderboard, with the top performer sitting at the upper edge and the remaining categories cascading downward in order of magnitude. Viewers can then scan the chart from top to bottom and absorb the ranking without needing to compare bar lengths back and forth across the page.
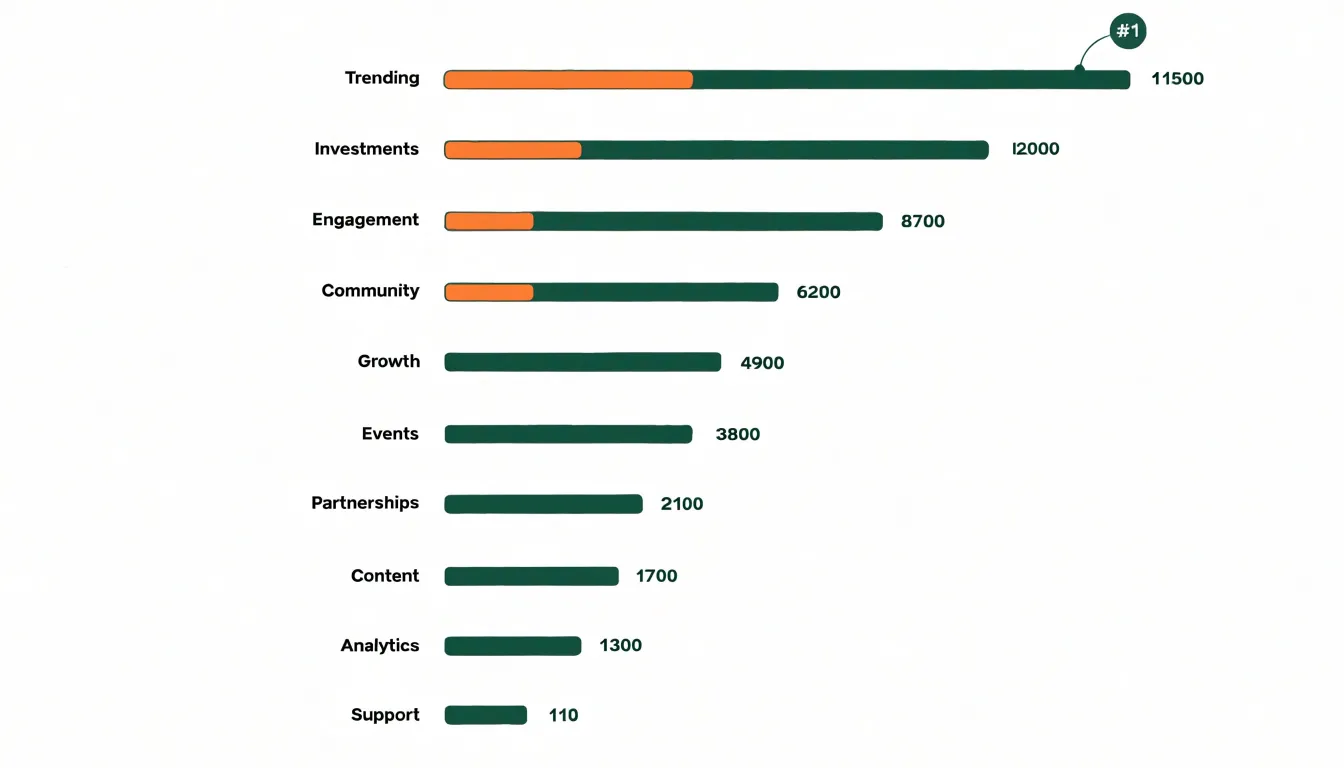
The horizontal orientation reinforces this effect in several practical ways. Category labels sit along the vertical axis, so longer names stay readable without rotation or truncation. Each bar occupies its own row, which gives every category a clear position in the sequence and reduces the visual clutter that comes from crowded axis labels. The result is a layout where the rank of each item is encoded twice: once by its vertical position and once by the length of its bar. This redundancy helps viewers confirm what they see at a glance.
A sorted horizontal bar chart also supports comparison across the full list. Readers can quickly identify the top few categories, spot the gap between first and second place, and trace how values taper toward the bottom. Ties and near-ties become easy to recognize because adjacent bars sit close together at similar lengths. For reports, dashboards, and presentations where the central message is who leads and by how much, this arrangement delivers the ranking directly, letting the audience focus on the story the numbers tell rather than on the effort of decoding the chart.
Negative Values
Negative values introduce a distinct set of layout challenges in both bar and column charts, since the zero line no longer sits at the edge of the plotting area but moves inward, splitting the chart into positive and negative regions. In a column chart, the vertical axis carries the scale, so the zero baseline typically becomes a horizontal line partway up the plot. Columns for negative values extend downward from that line rather than upward, and the chart’s vertical extent must expand to cover both the highest positive value and the lowest negative value. This keeps the zero line as a consistent anchor, so every bar length remains directly comparable in magnitude regardless of sign.
In a horizontal bar chart, the roles reverse: the category axis runs vertically and the value axis runs horizontally, so the zero baseline becomes a vertical line positioned somewhere across the width of the chart. Bars for negative values extend leftward from that line while positive bars extend rightward. The plotting area widens to accommodate the most extreme negative value on the left and the most extreme positive value on the right, and the zero line shifts accordingly so that the full span of data remains visible within a single frame.
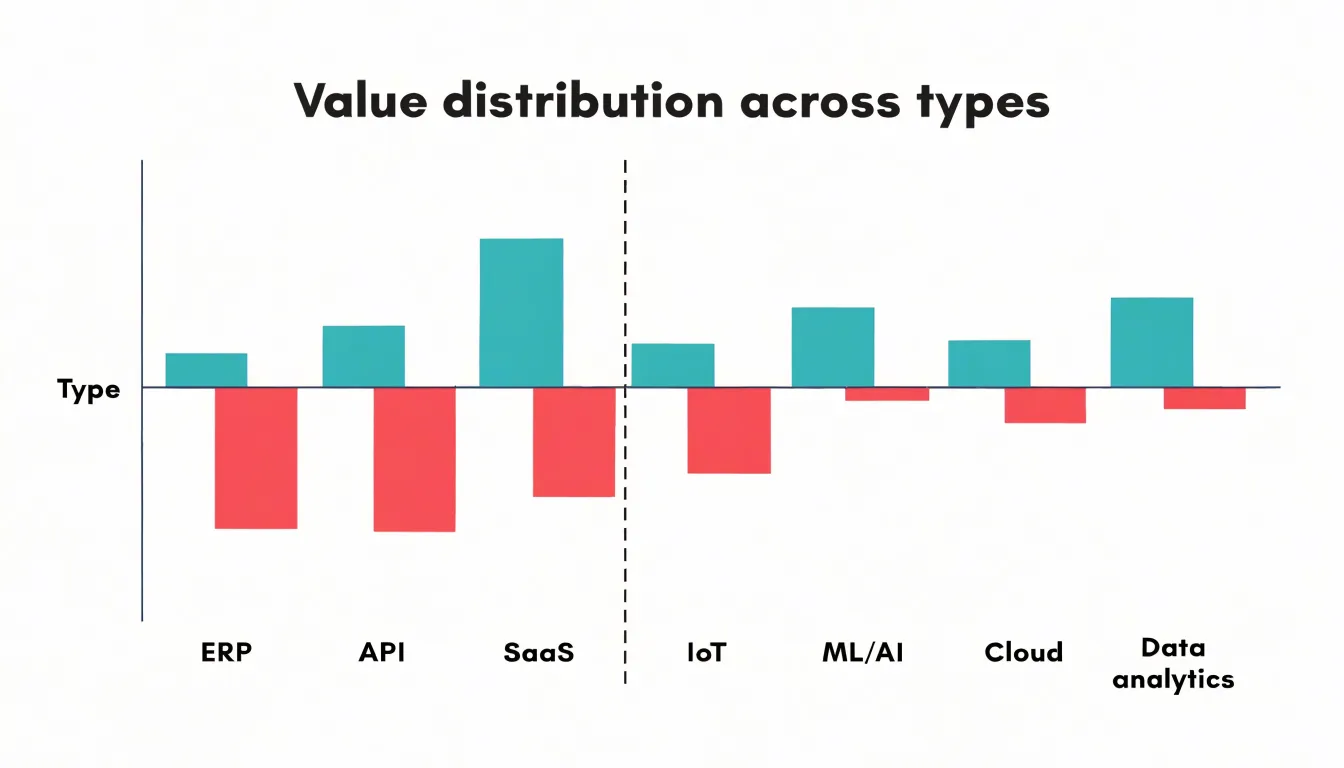
In both orientations, the key to avoiding distortion is a single continuous value scale that crosses zero, with the zero position fixed and shared by all categories. Categories can then be read against the same reference line, whether they contain gains, losses, or a mix of both. Mixed-sign datasets particularly benefit from keeping that baseline visually distinct, often with an emphasized axis line, so viewers can quickly see which categories fall above or below zero without recalculating values in their heads. Allowing the axis to stretch symmetrically around zero, where appropriate, further preserves proportional accuracy across the entire dataset.
Grouped Charts
Grouped charts, often called clustered bar or column charts, allow you to compare multiple sub-categories side by side within a single category. The core structure involves placing bars for each sub-group next to one another along the same axis, typically with a small gap between groups and a larger gap between categories. This arrangement makes it easy to see patterns such as which sub-group is highest or lowest within each category, and how those rankings change across categories.
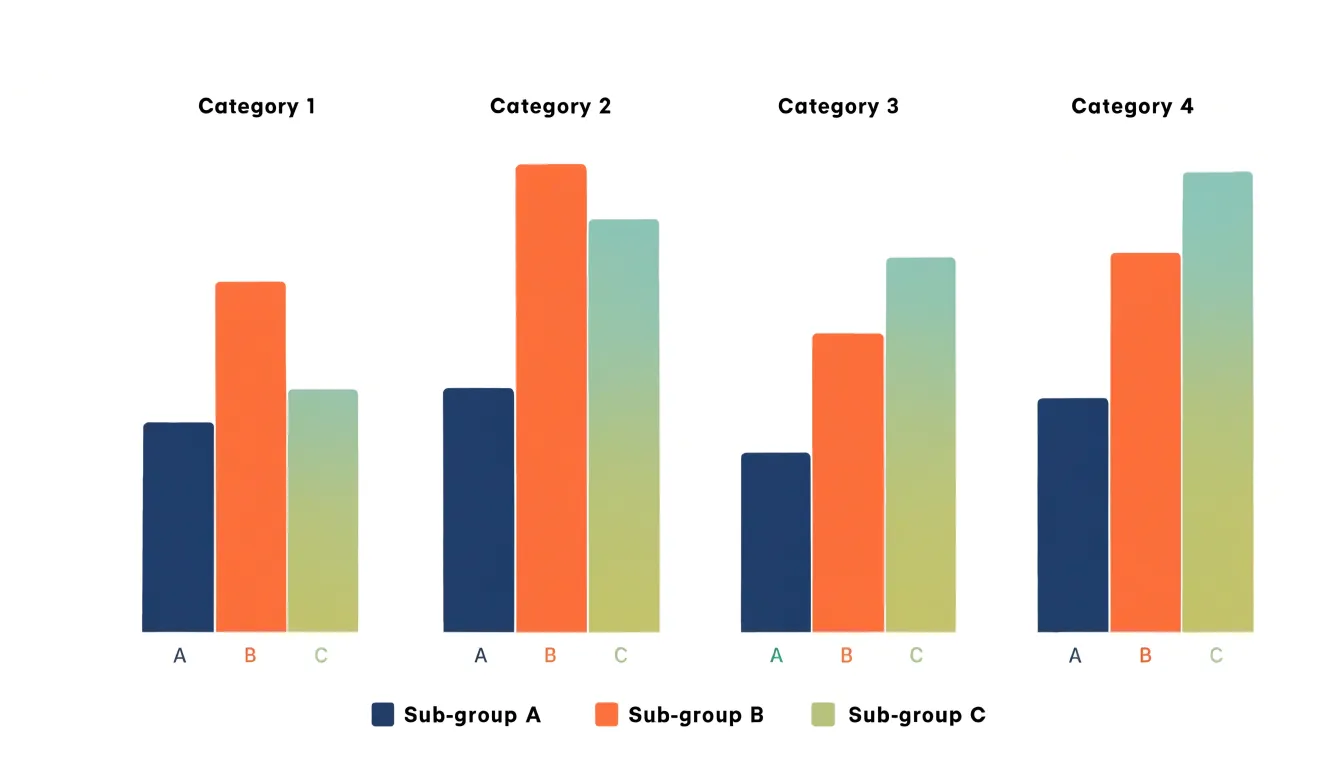
To highlight complex relationships, consider the ordering of sub-groups. Consistent ordering across all categories—for example, always placing sub-group A first, then B, then C—helps viewers track changes. If the sub-groups have a natural hierarchy (e.g., low, medium, high), maintain that order. Color coding is also crucial: assign distinct colors to each sub-group and use a legend. When possible, choose colors that are distinguishable for color-blind viewers, such as varying hue and lightness.
Another method is to use a consistent scale. Ensure that all bars share the same axis scale so that comparisons are valid. Avoid using 3D effects or shadows, which can distort perception. For many sub-groups (more than four or five), consider a different chart type, as grouped bars can become cluttered.
When the goal is to emphasize trends within sub-groups, you might sort categories by the value of a particular sub-group. This draws attention to that sub-group’s performance relative to others. Additionally, you can add data labels directly on bars if precise values are important, but use them sparingly to avoid visual noise.
In summary, grouped charts are powerful for side-by-side comparisons when designed with careful ordering, consistent color use, and a clean layout. They reveal interactions between sub-groups and categories that might be missed in separate charts.
Stacked Charts
Stacked charts extend the basic bar and column format by dividing each bar or column into segments that represent subcategories. The full length of the bar corresponds to the total value, while each segment shows how much a particular component contributes to that total. This makes stacked charts a natural fit for part-to-whole comparisons, since a reader can see both the overall magnitude of a category and the internal composition in a single visual. For example, a stacked column chart might display quarterly revenue as a total, broken down by product line, allowing viewers to compare both total revenue across quarters and the shifting mix of products within each quarter.
The main advantage of stacked charts is this dual reading: totals and proportions appear together in one compact graphic. They also work well when the number of subcategories is small, typically three to five segments, because each segment remains large enough to interpret. Color coding reinforces the mapping between segments and legend entries, and consistent segment ordering across bars helps readers track a single component from one category to the next.
Stacked charts carry limitations worth weighing. Only the bottom segment shares a common baseline, so comparing the sizes of middle or upper segments across bars is difficult; readers judge those segments by their height within a floating position rather than from zero. When many subcategories exist or segment sizes vary widely, small segments become slivers that are hard to read and label. Totals can also dominate attention, drawing the eye away from the proportional story. A 100 percent stacked variant solves the total-comparison problem by normalizing every bar to the same length, which emphasizes proportions at the cost of showing absolute values. Choosing between stacked and 100 percent stacked forms depends on whether the audience needs to see totals, proportions, or both.
Common Mistakes
Clutter and misleading scales are among the most frequent problems in bar and column chart design, and both interfere with the reader’s ability to judge values accurately. A non-zero baseline is the classic offender. When the vertical axis starts at a value other than zero, the visible height of each bar reflects only the distance from that starting point rather than the full magnitude of the data. Small differences between values then appear dramatic, and readers come away with an inflated sense of contrast that the underlying numbers do not support. Keeping the baseline at zero preserves the proportional relationship between bar length and value, which is the entire basis for reading a bar or column chart correctly.
Excessive visual clutter compounds the problem. Gridlines, borders, shadows, background fills, and data labels piled onto every element compete for attention and slow comprehension. Each added decoration pushes the actual data further into the background. Restraint helps: a light grid or none at all, clean axes, direct labeling where it adds clarity, and generous white space allow the bars themselves to carry the message. Truncated or crowded axis labels and overlapping category names create a similar drag on readability.
Color choices matter as much as layout. Using many unrelated hues for a single series implies distinctions that do not exist, while low-contrast palettes make categories hard to tell apart. Sequential or categorical palettes should match the structure of the data, with a consistent mapping from color to category across the chart. Colors also carry cultural and accessibility implications, so relying on hue alone can exclude readers with color vision deficiencies. Careful, deliberate use of color directs attention to the comparison that matters and keeps the chart honest about what it shows.
Large Datasets
When a dataset contains dozens or even hundreds of categories, the choice between a horizontal bar layout and a vertical column layout has a direct effect on readability. The first practical strategy is to examine the labels. Long category names fit comfortably along the vertical axis of a horizontal bar chart, where each label sits on its own line and reads left to right. In a column chart, those same labels must be rotated or truncated to fit beneath narrow columns, which slows comprehension and introduces ambiguity. If the category names are lengthy or descriptive, the horizontal layout removes that friction entirely.
A second strategy concerns the number of categories. As counts climb, vertical columns become thin slivers packed tightly together, and the eye struggles to compare heights across a crowded baseline. Horizontal bars preserve a consistent thickness regardless of how many rows are added, and the chart simply grows taller. This makes the horizontal format more forgiving when the series count is uncertain or likely to increase over time.
Density also affects how the reader scans for patterns. Horizontal bars align their endpoints along a common left edge, so ranking and comparison happen almost automatically as the eye moves down the list. Sorting the bars by value turns the chart into an ordered ranking, which is often the fastest way to communicate the top and bottom performers in a large set. Column charts can be sorted too, but the left-to-right reading order competes with the natural top-to-bottom ordering of a ranked list.
Finally, consider screen and page space. A horizontal layout absorbs many categories by extending downward, which suits scrolling interfaces and tall report pages. A vertical layout spreads sideways and may require scrolling or shrinking to fit. For high-density data, the horizontal orientation generally keeps labels legible, bars distinguishable, and the reading task simple.
Accessibility
Accessibility is a core requirement for any chart, ensuring that all readers can interpret the data regardless of visual ability or device. Start with a color-blind friendly palette. Avoid red-green combinations, which are indistinguishable for many people with common forms of color vision deficiency. Instead, use hues that differ in lightness and saturation, such as blue and orange, and reinforce distinctions with patterns or direct labels. High-contrast text is equally important. Axis labels, data values, and titles should meet WCAG contrast ratios, typically 4.5:1 for normal text and 3:1 for large text, against their background. This helps readers with low vision or those viewing charts on screens in bright environments. Direct labeling means placing category names or values directly on or next to the relevant bars or columns, eliminating the need to cross-reference a legend or axis. This reduces cognitive load and supports readers with memory or attention difficulties. For screen-reader compatibility, provide a text alternative that summarizes the chart’s key insights, not just the raw data. Use semantic markup such as a table or ARIA roles to convey structure, and ensure that any interactive elements are keyboard navigable. Together, these practices make charts inclusive, allowing a wider audience to grasp the comparison between bar and column charts quickly and accurately.
Decision Guide
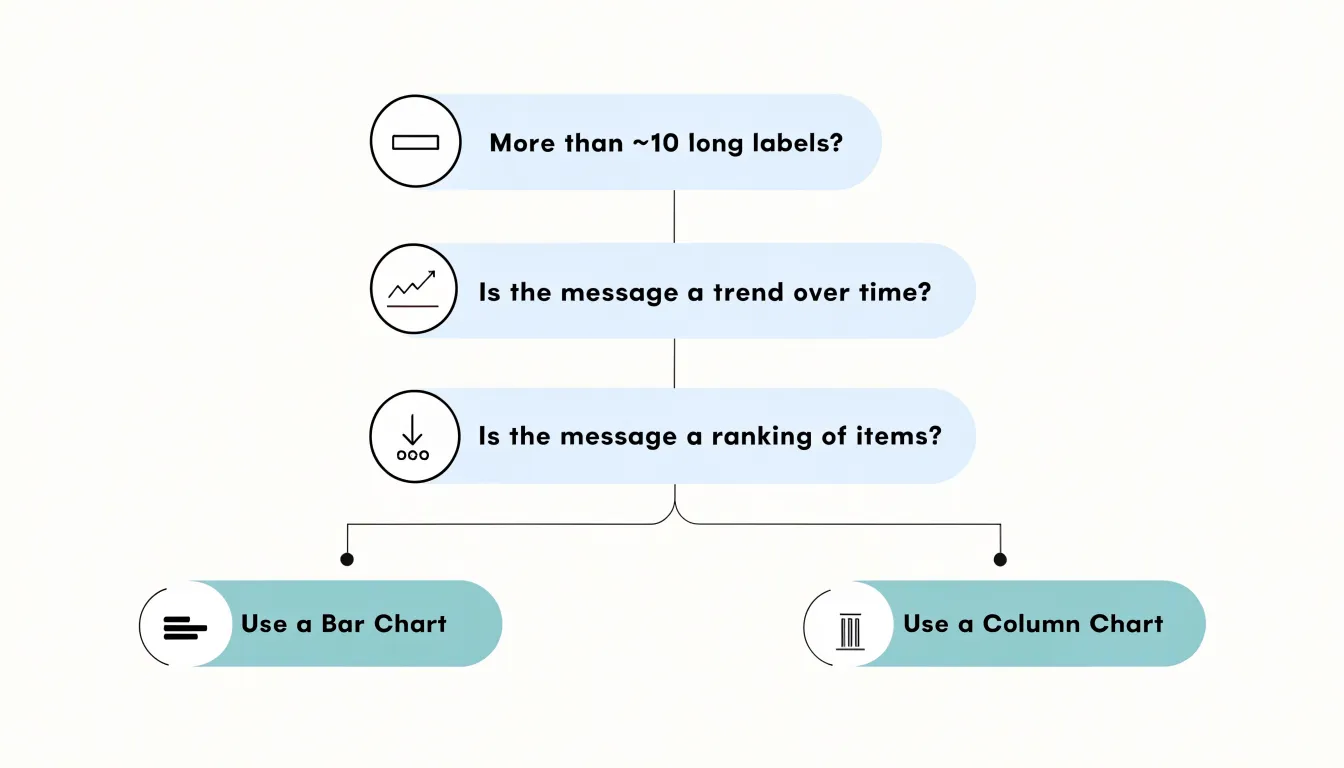
A practical decision guide for choosing between bar and column charts begins with three simple questions. First, consider your data type. If your categories are nominal—such as names of products, countries, or teams—and you have more than about seven to ten categories, a horizontal bar chart often serves better because it accommodates long labels and many items without crowding. For ordinal data with a natural order, such as age groups or satisfaction levels, column charts can work well when the sequence reads left to right. Second, examine your label length. Long category names, like full department titles or survey responses, become difficult to read when placed under vertical columns. Rotating labels can help, but horizontal bars keep text upright and legible. A quick rule: if labels exceed roughly fifteen characters, lean toward a bar chart. Third, identify your core message. Are you emphasizing magnitude comparisons among many items? Bar charts excel at ranking and comparing values across categories. Are you showing a trend over time or a sequence of steps? Column charts, with their vertical orientation, align naturally with progression from left to right. They also work well when the number of categories is small and labels are short. As a final check, consider the available space. Wide layouts with limited height favor column charts, while tall, narrow layouts suit bar charts. Keep this checklist handy: count your categories, measure your labels, and state your main point. The answers will point you toward the chart that communicates your data clearly and efficiently.
Dashboard Overview
When embedding bar and column charts into dense executive dashboards and recurring analytical reports, layout decisions shape whether the audience absorbs the message quickly or spends time deciphering the display. Executives scan dashboards in short bursts, so each chart must earn its space and communicate its point with minimal cognitive effort. Start by assigning every chart a clear priority within the overall grid. Primary metrics deserve prominent placement, typically in the top-left region where most readers begin scanning, while supporting charts occupy secondary zones. Consistent alignment across rows and columns creates visual rhythm that helps viewers move through the dashboard without friction.
Sizing deserves careful attention. Column charts work well in wider panels where the horizontal axis can display category labels without rotation, while bar charts suit narrower vertical panels since category names read horizontally along the y-axis. Reserve adequate whitespace around each chart so axis labels, legends, and titles remain legible at typical viewing distance and in printed reports. Recurring analytical reports benefit from fixed chart dimensions across editions, letting regular readers track changes without reorienting themselves each cycle.
Color and styling should follow a restrained system tied to the dashboard’s hierarchy. Use a single accent color for the metric under discussion and neutral tones for context series, keeping the palette consistent across all embedded charts. Legends can often be eliminated when direct labeling or a shared legend serves the whole page. Titles should state the finding rather than merely naming the data.
Finally, plan for scalability. Dashboards grow over time, so establish a modular grid system with defined gutters and panel widths that accommodate new charts without redesigning the whole layout. Test the finished arrangement on the screens and print formats the audience actually uses, checking that dense panels remain readable when viewed at a glance.
Frequently Asked Questions
What is the difference between a bar chart and a column chart?
A bar chart places categories on the vertical axis and values on the horizontal axis, while a column chart places categories on the horizontal axis and values on the vertical axis. This makes horizontal bars better for long labels, while vertical columns read naturally for time-based sequences.
When should I use a horizontal bar chart for long category labels?
Use a horizontal bar chart when category labels are long, because the text runs horizontally along the y-axis and can stay upright and legible. This avoids the rotated, wrapped, or truncated labels that can occur under vertical columns.
How do column charts work for time series data?
Column charts place time along the horizontal axis from left to right, so a sequence of columns can read like a visual timeline. The article recommends keeping intervals evenly spaced, starting the value axis at zero whenever possible, and labeling the time axis directly.
How can I use a bar chart to rank categories?
Sort the categories in a horizontal bar chart from highest to lowest value so the top performer sits at the upper edge and the remaining categories cascade downward. This turns the chart into a leaderboard, with rank shown by both vertical position and bar length.
What common mistakes should I avoid in bar and column charts?
Avoid a non-zero baseline, since it can exaggerate small differences and mislead viewers about the scale of change; keep the baseline at zero to preserve proportional accuracy. Also reduce clutter and use deliberate color choices rather than many unrelated hues or low-contrast palettes.
How can I make bar and column charts accessible?
Use a color-blind friendly palette and avoid red-green combinations, which are indistinguishable for many people with common forms of color vision deficiency. Use high-contrast text that meets WCAG contrast ratios, direct labels where possible, and provide a text alternative that summarizes the chart’s key insights for screen-reader users.
Tony Astor
Tony writes about data visualization and the tools people use to build charts and dashboards. More about Data Illustrator