Area Chart vs Stacked Area Chart: Key Differences
 By Tony Astor ·
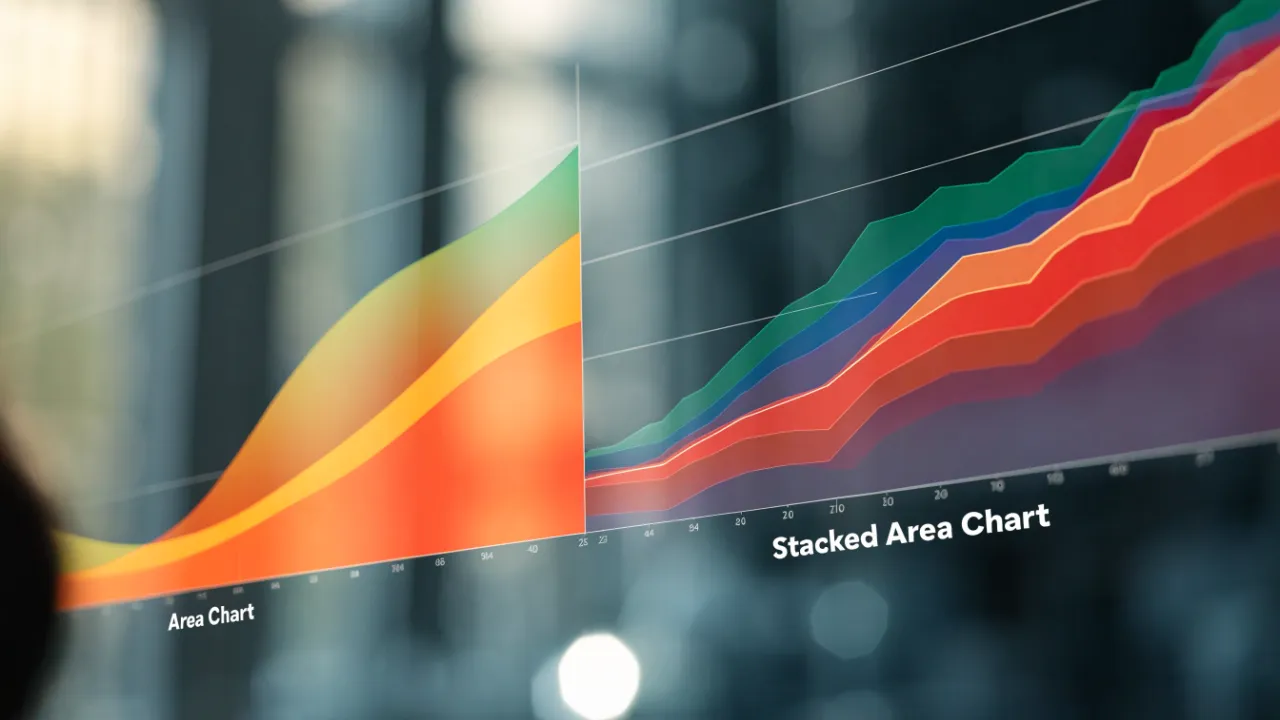
Area Chart vs Stacked Area Chart
An area chart is a line graph with the space below the line filled in, emphasizing the magnitude of a single continuous variable over time. A stacked area chart layers multiple additive series on top of each other, showing both the combined total and each category’s relative contribution, though only the bottom band keeps a stable baseline.
Table of Contents
Area Chart
An area chart is a line graph with the space beneath the line filled in, typically with a solid color or a gradient. The line represents the value of a variable at each point in time, while the filled area emphasizes the magnitude of that value by giving it visual weight. This makes the chart particularly effective for displaying a single continuous trend over time.
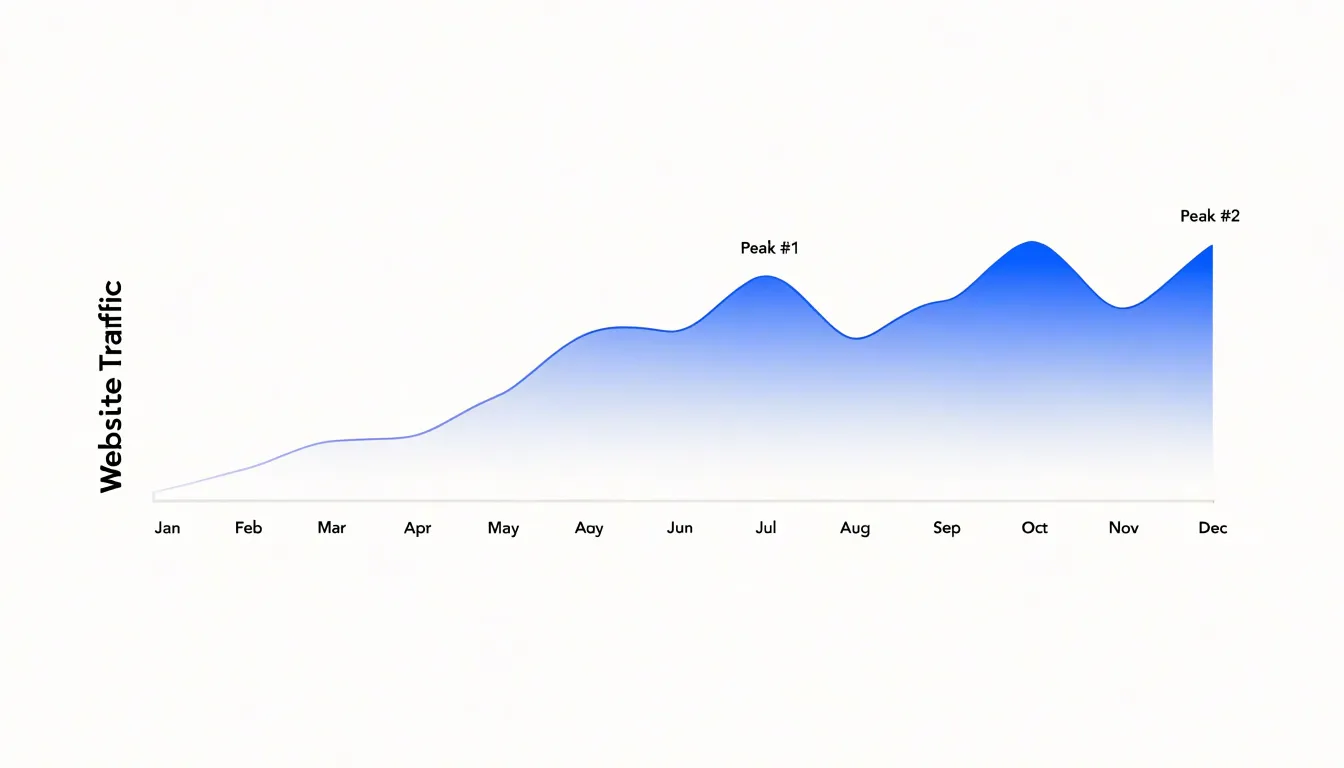
For example, a company might use an area chart to show monthly website traffic over a year, with the height of the line indicating the number of visitors and the filled area reinforcing overall volume. The fill creates a sense of continuity, as if the data flows from one period to the next, which aligns with the nature of continuous temporal data. Unlike a simple line chart, which can appear thin and detached, the area chart’s fill anchors the line to a meaningful baseline (e.g., zero), making it easier to perceive the relative size of values and quickly grasp periods of growth, decline, or stability. Designers often use a single color with varying opacity to maintain focus on the trend without introducing unnecessary visual complexity.
Stacked Area Chart
A stacked area chart places multiple data series directly on top of one another, so that each band begins where the previous one ends rather than sharing a common baseline. The cumulative height of the bands at any point along the horizontal axis represents the total value of all categories combined at that moment. This arrangement allows a reader to trace two distinct stories at once: the trajectory of the overall total and the relative contribution of each individual category within it. When the top edge of the chart rises, the aggregate is growing; when the proportions between bands shift, the internal composition of that total is changing.
This stacking logic suits situations where categories are genuinely additive, such as revenue streams that sum to total sales, spending categories that roll up into a departmental budget, or energy sources that combine into overall consumption. By layering series in this way, the chart preserves the sense of a whole while still giving each component its own visible space. A reader can see, for example, that total output climbed steadily over a decade while one band expanded its share and another quietly narrowed, all within a single visual frame.
The order in which series are stacked matters, since only the bottom band rests on a flat baseline and retains a stable shape as values fluctuate. Bands higher in the stack shift vertically whenever the series beneath them change, which can obscure the pattern of an individual category. Careful ordering, usually placing the largest or most stable series at the bottom, helps keep the chart legible. Stacked area charts also work best when the number of categories stays modest, since too many thin bands become difficult to distinguish and compare.
Area Chart
Because a single-series area chart encodes only one variable—such as monthly revenue, active users, or production volume—every visual element points toward the same interpretation. The slope of the line, the height of the filled region, and the position of peaks and troughs work together without competing layers to distinguish, bands to decode, or ambiguity about whether the top edge or a cumulative total represents the actual number.
This clarity matters most in executive reporting, where readers typically spend only a few seconds with each chart before drawing a conclusion or asking a follow-up question. A viewer can immediately see whether the metric is growing, declining, or holding steady, and how the current period compares with earlier ones.
Annotations such as a reference line for a target, a shaded band for a forecast, or a marker for a launch event can be added without overwhelming the display, since the base visualization remains uncluttered. The chart also scales down gracefully to small formats such as slide decks and dashboard tiles, where fine distinctions between multiple series would be lost, turning a simple time series into a clear narrative that requires no explanation beyond the title and axis labels.
Stacked Area Chart
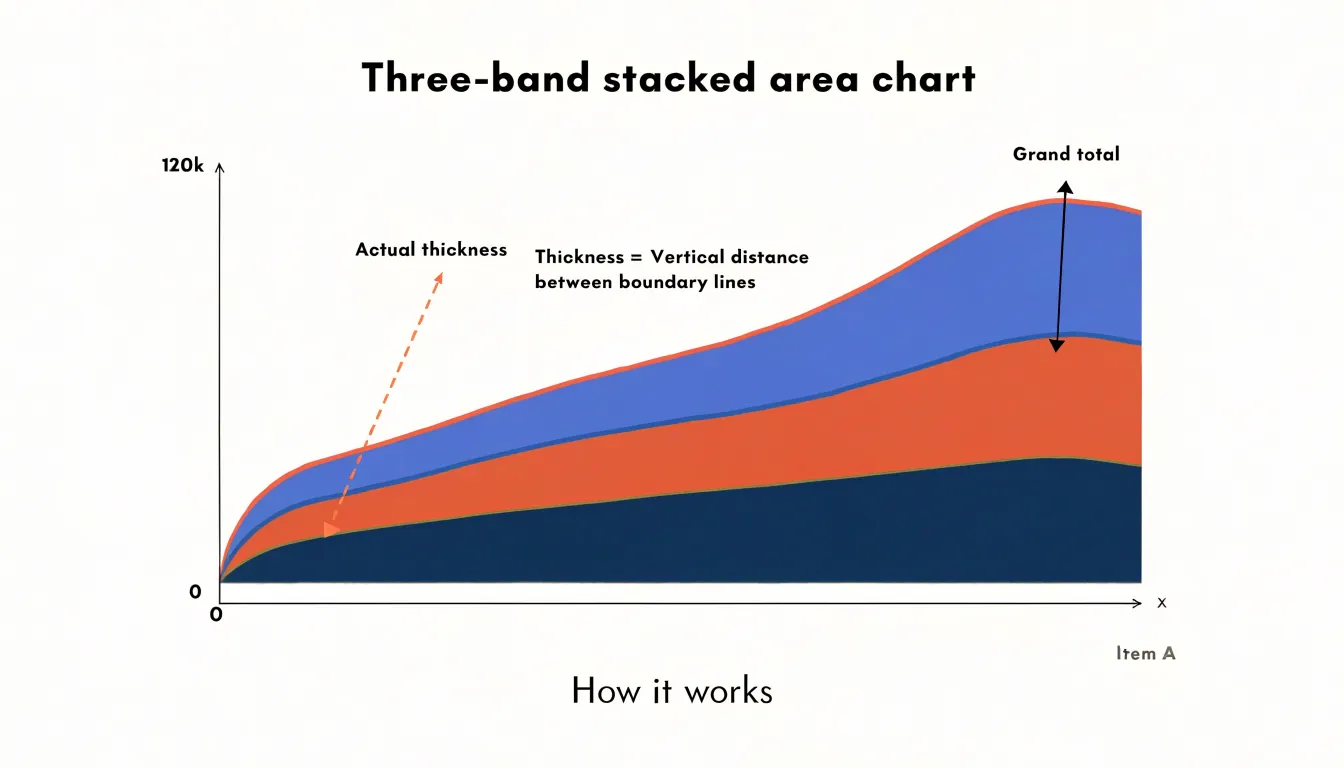
In a stacked area chart, the vertical distance between any two boundary lines corresponds to the value of one specific segment, while the topmost line traces the grand total. The part-to-whole reading depends on this stacked geometry. A segment that maintains the same thickness over the full width of the chart represents a stable contribution, whereas a segment whose band widens or narrows signals growth or decline relative to the others. The proportional breakdown is visible as the share of total height each band occupies at a given position along the axis, which makes the chart well suited to showing how a population distributes across age groups over time.
Certain perceptual limits accompany this design. Because only the bottom layer rests on a flat baseline, segments higher in the stack are bounded by curves rather than straight lines, which complicates precise comparison of their individual magnitudes. These characteristics favor stacked area charts for communicating broad trends in composition rather than for reading exact values from individual bands.
Overlapping Colors
When multiple unstacked area series are plotted in the same space, the filled regions beneath each line occupy the same visual territory. Because each series fills the area down to the baseline, any series with larger values will cover the regions of series with smaller values. Whole sections of data disappear behind the color of whichever series happens to be drawn on top, leaving a reader looking at only the frontmost layer while the rest is hidden from view.
Transparency is the usual remedy, but it introduces its own confusion. Semi-transparent fills blend wherever they intersect, producing new shades that do not correspond to any series in the legend. A two-color overlap creates a third color, and three or more overlapping layers create an increasingly muddy mixture. Readers then have to mentally reverse-engineer which combination of colors produced a given hue, which adds cognitive work that distracts from the actual comparison. The blended tones also vary with the density of overlap, so the same series can appear as different colors in different regions of the chart.
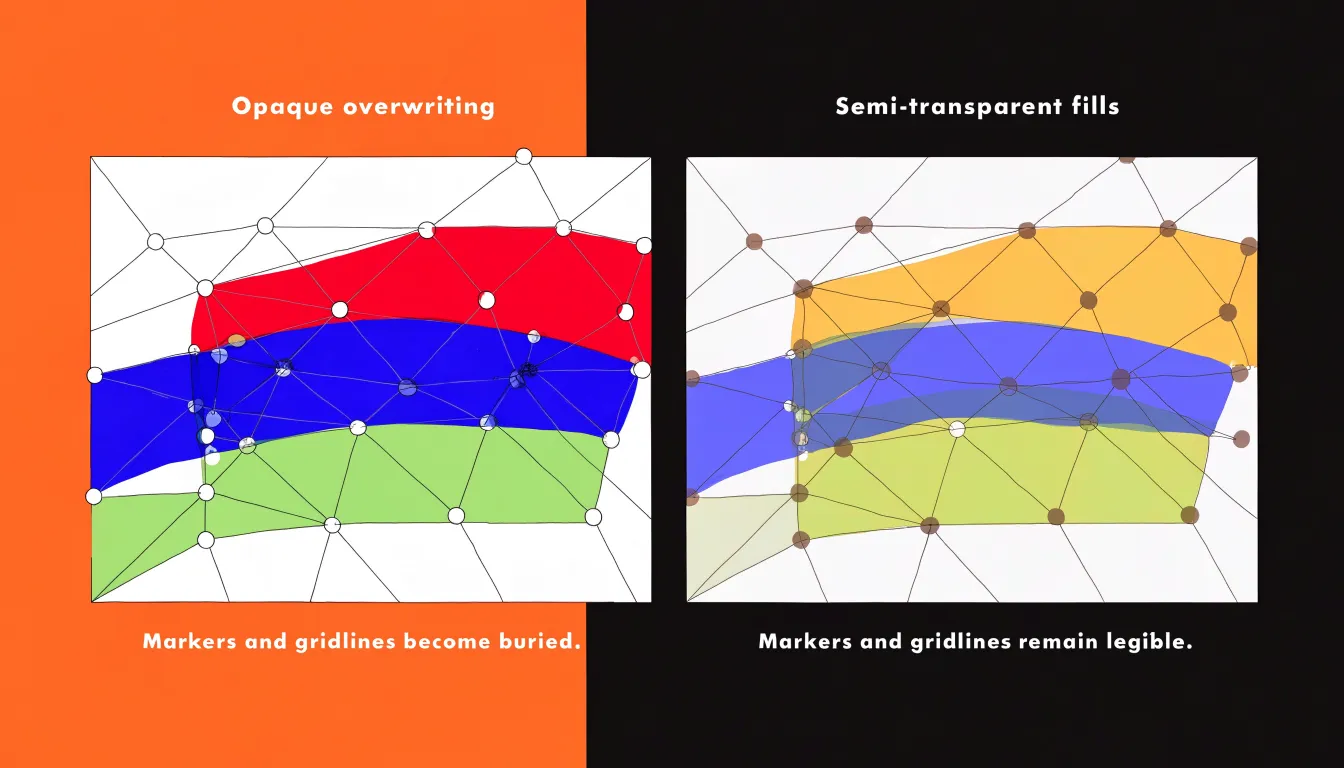
Data points and line strokes suffer as well. Markers placed on each series become harder to distinguish when they sit on top of tinted fills, and gridlines or reference lines fade beneath layers of color. Important thresholds and individual observations get visually buried. Each added series compounds the problem, so the chart degrades progressively as more data is layered in, concealing the relationships it was meant to reveal.
Non-Zero Baselines
In a stacked area chart, every layer above the bottom one sits on a moving floor formed by the cumulative total of all the layers beneath it, rather than a fixed reference line. The visual thickness of a middle layer therefore reflects the difference between two cumulative totals, each of which may be shifting at the same time.
Consider a three-layer chart where the bottom layer grows steadily while the middle layer stays completely constant. The middle band’s lower edge is climbing while its upper edge climbs by the same amount; any wobble in the lower layers is inherited by every band stacked above. When the bottom series dips, the bands above it slide downward and can appear to shrink or swell even when their underlying data is stable. Viewers tracking a middle layer’s trajectory are effectively reading the net result of two or more series combined, and the eye is poorly equipped to subtract one cumulative curve from another.
Each additional layer introduces another moving baseline and another opportunity for misreading. Small changes in a lower layer propagate upward and can create apparent trends in bands whose own values are flat. This makes stacked area charts unreliable for answering questions about individual segment performance over time, such as whether a particular product line grew or shrank.
Area Chart
An area chart is particularly effective when the variable is cumulative or represents a total, such as overall sales volume, because the shaded space starting at zero is proportional to the value and naturally communicates accumulation. When the data has a natural zero baseline, the chart also highlights periods of positive growth or shortfall, allowing stakeholders to quickly assess the cumulative effect of a single metric without the visual clutter of multiple overlapping categories.
Stacked Area Chart
Stacked area charts are especially useful for tracking concrete business or resource transitions across several periods:
- Revenue by product line: Over several quarters, total revenue appears as the top edge of the stack while each product line forms a colored band. If the total is rising but one product line’s band is shrinking, it immediately signals a shift in the revenue mix.
- Energy consumption by source: Breaking total energy demand down into coal, natural gas, and renewables reveals both overall consumption trends and transitions in the underlying energy mix.
To avoid visual clutter and ensure each band remains distinguishable, keep the categories limited (typically five to seven at most) and keep their stacking order stable, as reordering categories across views can confuse interpretation.
Color Choices
A well-chosen color palette ensures that each layer in a stacked area chart stands out clearly, allowing viewers to trace individual series without confusion:
- High contrast between adjacent layers: When two neighboring areas share similar hues or lightness, their boundary blurs. Using a sequence of colors that differ in both hue and luminance creates distinct edges, even when layers are thin or viewed on small screens.
- Intuitive color ordering: Arrange colors so they progress logically—either by using a sequential palette that moves from light to dark as the stack grows, or by grouping related categories with similar hues of varying saturation. Avoid palettes that imply a natural ordering when none exists, such as a rainbow palette, which can mislead.
- Accessibility: Ensure the palette works for people with color vision deficiencies by avoiding problematic combinations like red and green, and test palettes with color blindness simulators. Supplementing colors with patterns or textures can also aid differentiation when color alone is insufficient.
Category Limits
While five to seven categories is a ceiling, limiting a stacked area chart to roughly three to five distinct categories is one of the most practical design decisions. Each additional layer adds another band of color, another boundary line, and another entry to the legend, all competing for the reader’s attention. When a stacked chart carries six, eight, or a dozen series, the thinner bands become difficult to distinguish, boundaries blur, and the mental arithmetic required to subtract lower layers becomes more error-prone.
Keeping the count within three to five categories lets each band retain enough thickness to be legible and gives each color a clear identity in the legend. Once series proliferate beyond this threshold, the chart turns into a texture rather than a comparison, and readers resort to hovering over individual points or abandoning the chart entirely. A common solution is to group the smallest contributors into a single residual category, such as ‘Other’, which preserves the completeness of the total while keeping the visual field uncluttered. Beyond this range, a different chart form or a filtered subset usually serves the analysis better.
100% Stacked Area Chart
A 100% stacked area chart takes the stacked area format and normalizes each layer so that the total at every point in time equals 100 percent. Instead of plotting raw magnitudes, the chart displays each category’s share of the whole against a uniform percentage scale from 0 to 100, with the layers re-scaled so their combined height always fills the full range.
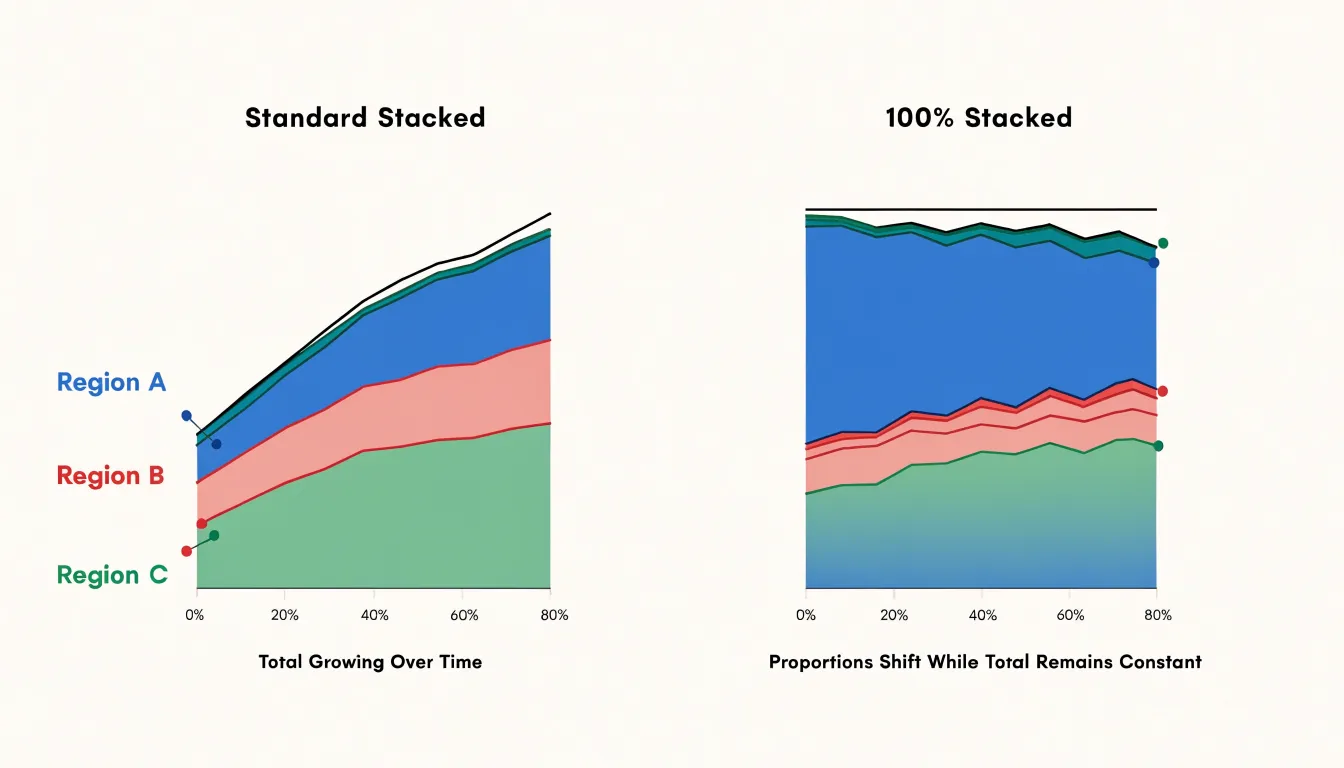
This transformation shifts the visual emphasis from absolute values to composition, showing how the percentage distribution among categories evolves even when the overall total fluctuates widely. For example, if total sales double over a period, a standard stacked area chart shows all layers growing in height, which can obscure changes in market share. In a 100% stacked area chart, the total height remains constant and only the relative thicknesses of the layers change, highlighting shifts in dominance or decline.
This format is particularly useful for survey data, budget allocations, or market segmentation where the question is about proportions rather than magnitudes. However, because normalization can mask significant changes in absolute terms, it is best used when the overall total is either irrelevant or secondary to the composition.
Negative Values
Area charts encounter a fundamental structural limitation when the underlying data contains negative values, because filling the region between the data line and the baseline assumes that this filled space represents a positive, meaningful quantity. When values drop below zero, the fill extends downward from the zero axis, occupying the same visual plane as the positive region above it and forcing readers to mentally reconstruct which segment belongs to which sign.
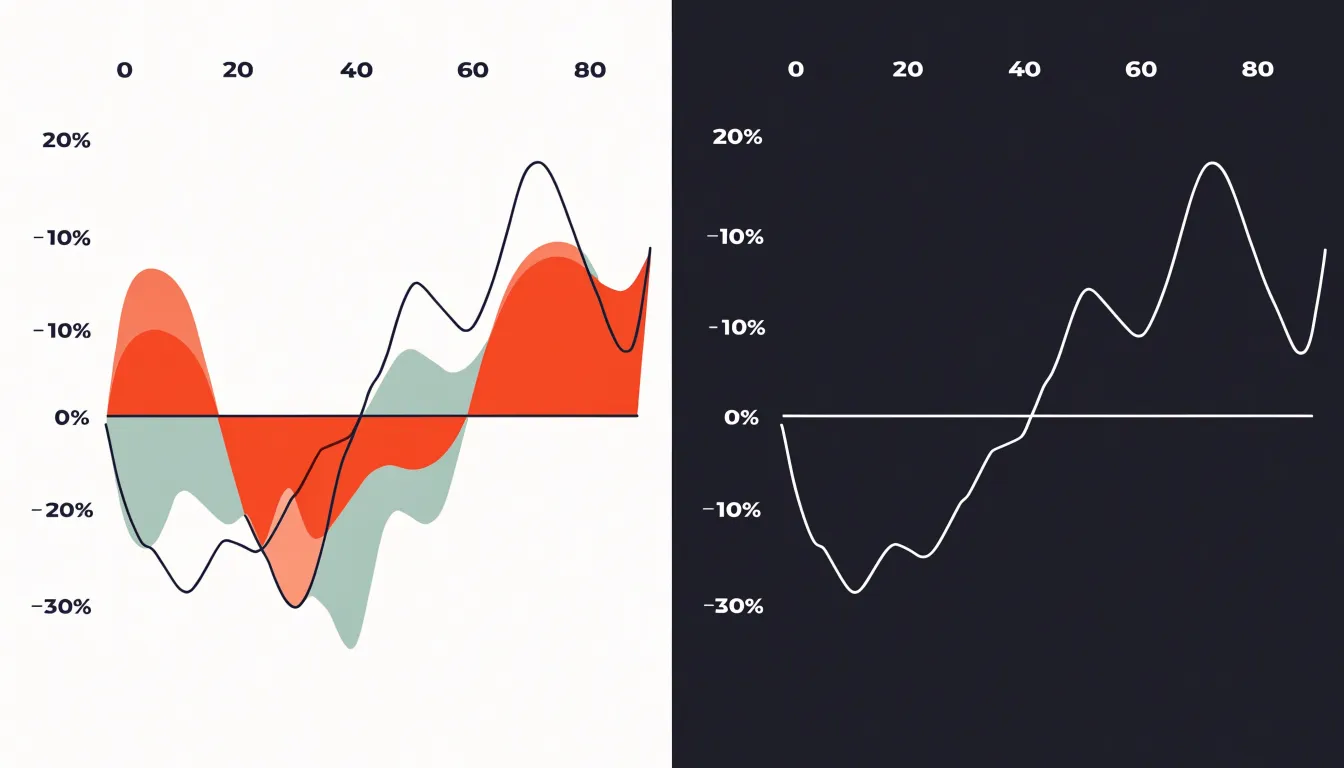
This becomes especially problematic when several series are plotted together. Lines that cross the zero axis create overlapping filled regions whose intersections correspond to neither series individually. A viewer cannot easily tell whether a crossing point reflects a genuine change in ranking, a simple sign change, or merely the artifact of one filled band obscuring another. When series alternate between positive and negative territory across successive categories, the fill toggles direction repeatedly and generates a fragmented, patchwork appearance that legends and translucent color coding cannot fix.
For datasets where negative values are expected—such as profit and loss figures, temperature anomalies, or net changes in account balances—an area chart tends to mislead rather than clarify. Analysts working with mixed-sign data are generally better served by chart types that represent each value independently, such as grouped bars or lines without fills, which preserve a clear correspondence between the plotted mark and the underlying number regardless of sign.
Line Chart vs Area Chart
The choice between a line chart and an area chart depends on whether volume or precision carries more weight in the message. While an area chart uses shaded volume to emphasize magnitude, cumulative totals, or proportional shares, a line chart excels at precise value tracking, showing the exact position of individual data points and the shape of a trend across readings. The absence of fill keeps attention on the trajectory and gives each series a clean, uncluttered path, which is valuable when several overlapping categories are plotted together and the viewer needs to follow each one distinctly.
Data density and audience also guide the decision:
- Line charts afford clarity around specific plotted values in small datasets, narratives that hinge on the latest reading, and analytical dashboards where readers scrutinize exact points.
- Area charts work well for quick executive summaries where communicating overall scale at a glance matters more than reading individual points.
Dashboards
Most modern reporting tools provide both simple and stacked area chart options, and the choices made during setup determine whether the result reads clearly or becomes a muddled block of color. If you plot an unstacked multi-series area chart, give each series a flat, semi-transparent fill and limit the chart to two or three series at most so overlapping regions remain legible.
- Tableau: Build an area chart by placing a continuous date field on Columns and a measure on Rows, then dragging a dimension onto Color. Set the mark type to Area and adjust the opacity slider on the Color shelf so layered regions stay visible. Tableau’s stacked area option appears automatically when multiple members share the Color shelf, so you can switch between the two treatments by moving the dimension on or off that shelf.
- Power BI: Use the native Area Chart and Stacked Area Chart visuals. Put the date on the X-axis and the category on the Legend, then add your measure to Values. Use the formatting pane to set transparency, define a consistent color palette, and decide whether the y-axis should start at zero. For stacked variants, keep the legend order stable and consider adding data labels only to the topmost band to avoid clutter.
- Looker Studio: Choose the stacked area chart type, assign a date dimension, set the breakdown dimension for the stack, and use the style panel to control fill opacity and axis formatting.
Across all three platforms, align your color choices with the rest of the dashboard, round axis values, and test the chart at its actual display size before publishing, since legends and labels that fit in the editor often crowd the final view.
Chart Selection
Use this quick-reference checklist to match your dataset and intent to the right chart:
- Single time series: Use an area chart to highlight the overall trend and magnitude of one variable over time.
- Multiple additive categories: Use a stacked area chart when 3 to 5 categories sum to a meaningful whole (such as revenue by product line) and you want to show both the total and its composition.
- Non-additive metrics: Avoid stacked area charts for metrics that do not sum to a meaningful total (such as independent percentages that don’t sum to 100); use a line chart or a single-series area chart instead.
- More than five categories or individual trend comparisons: Switch to a line chart or small multiples when a stacked chart becomes too cluttered or when comparing the exact trajectories of individual categories is more important than showing the combined total.
Frequently Asked Questions
What is an area chart best used for?
An area chart is particularly effective for displaying a single continuous trend over time and for cumulative or total values such as overall sales volume, because the shaded space starting at zero is proportional to the value.
What is the difference between an area chart and a stacked area chart?
An area chart fills the space beneath a single line to emphasize the magnitude of one variable over time, while a stacked area chart places multiple data series on top of one another so the cumulative height represents the total and each band shows a category’s contribution.
When should I use a stacked area chart?
Use a stacked area chart when 3 to 5 additive categories sum to a meaningful whole, such as revenue by product line, and you want to show both the total and its composition. Avoid stacked area charts for non-additive metrics that do not sum to a meaningful total.
How many categories should a stacked area chart have?
Stacked area charts have a ceiling of typically five to seven categories at most, but limiting the chart to roughly three to five distinct categories is more practical. A common solution for extra series is to group the smallest contributors into a single residual category such as “Other.”
Why are overlapping colors a problem in multi-series area charts?
When multiple unstacked area series are plotted together, larger values can cover smaller ones, and transparency blends overlapping fills into new shades that do not correspond to any series in the legend. Markers, gridlines, and reference lines can also become visually buried beneath layers of color.
What is a 100% stacked area chart used for?
A 100% stacked area chart normalizes each layer so the total at every point equals 100 percent, shifting emphasis from absolute values to composition and percentage distribution. It is useful for survey data, budget allocations, or market segmentation where the question is about proportions rather than magnitudes.
Tony Astor
Tony writes about data visualization and the tools people use to build charts and dashboards. More about Data Illustrator