Arc Diagram: A Compact Way to Show Network Links
 By Tony Astor ·

Arc Diagram
An arc diagram is a graph visualization that places all nodes along a single horizontal or vertical axis and draws relationships as curved arcs above or below the baseline. The one-dimensional layout emphasizes sequence and adjacency, making it effective for revealing clusters, long-range connections, and hub nodes in ordered or sparse networks.
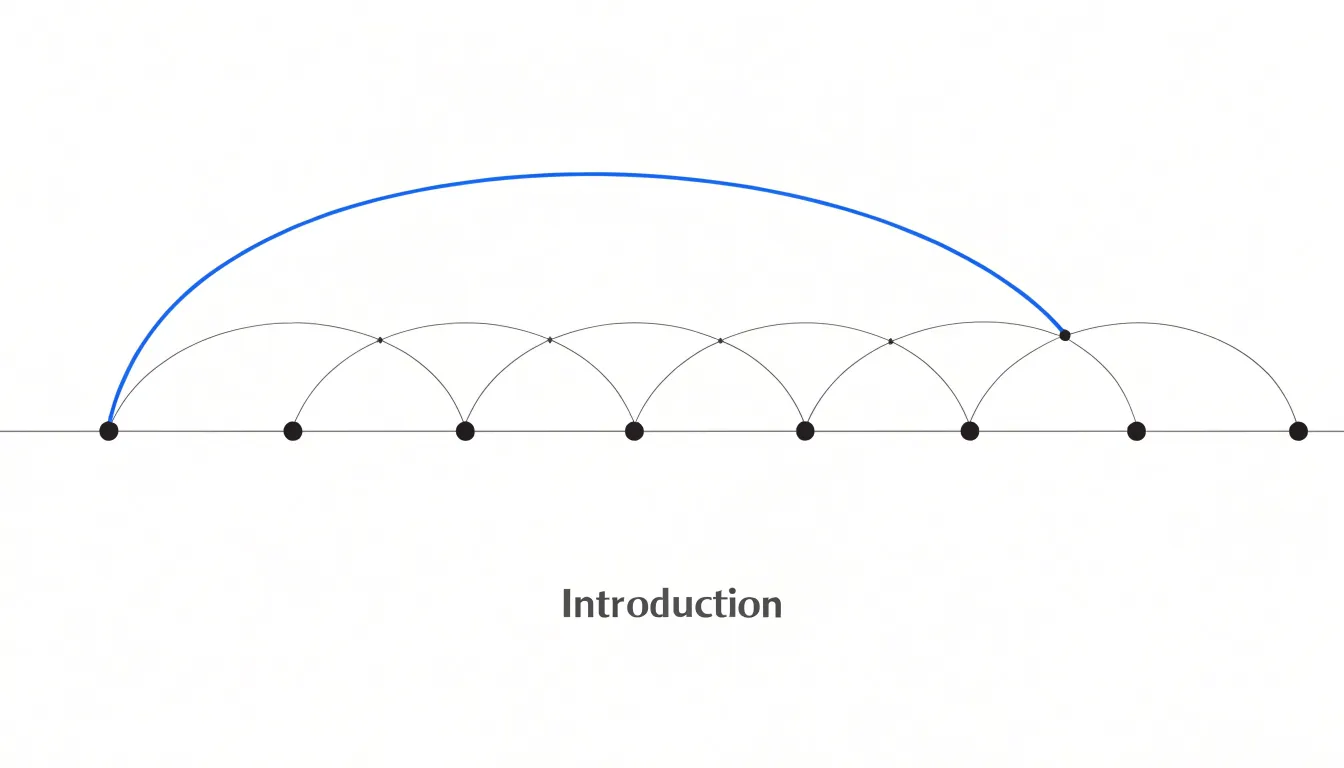
Table of Contents
Arc Diagram
An arc diagram is a graph visualization that arranges all nodes along a single horizontal or vertical axis and represents relationships between them as curved arcs. Nodes are typically drawn as small circles, squares, or other simple shapes, evenly spaced or positioned according to an ordering such as alphabetical order, chronological sequence, or a computed layout that groups related nodes together.
Each arc connects a pair of nodes, sweeping out into the space above or below the axis in a semicircular or elliptical path. Its curvature distinguishes it from a straight line, allowing multiple connections to be read without severe overlapping. The height or width of the arc is often proportional to the distance between the two nodes, which helps the eye trace longer connections. In many arc diagrams, arcs are drawn only on one side of the axis to keep the layout clean, though some variants use both sides to separate different types of relationships.
Because the nodes occupy a one-dimensional line, the diagram emphasizes the sequence and adjacency of elements rather than their absolute positions in a two-dimensional space. This makes arc diagrams particularly effective for showing repeated subsequences, hierarchical relationships, or network structures where the linear order itself carries meaning. The ordering of nodes along the axis is critical: a thoughtful sequence reveals clusters, bridges, and recurring patterns, while a poor ordering produces a tangled mass of overlapping arcs. Crossings and overlaps can also be managed through color, transparency, or bundling techniques to maintain readability.
Arc Diagram vs Node-Link Graph
While an arc diagram places all nodes along a single axis, a traditional node-link graph scatters nodes across a two-dimensional plane, placing connected pairs wherever the layout algorithm finds room. This geometric difference produces a real difference in legibility, especially as edge counts rise. In a 2D node-link layout, every edge is a free-floating segment that can cross unrelated nodes and other edges; crossings accumulate quickly, and readers must trace each line through a thicket of overlapping strokes. The arc diagram constrains the same information to a fixed baseline, so each connection begins and ends at a known position and its extent is visible at a glance.
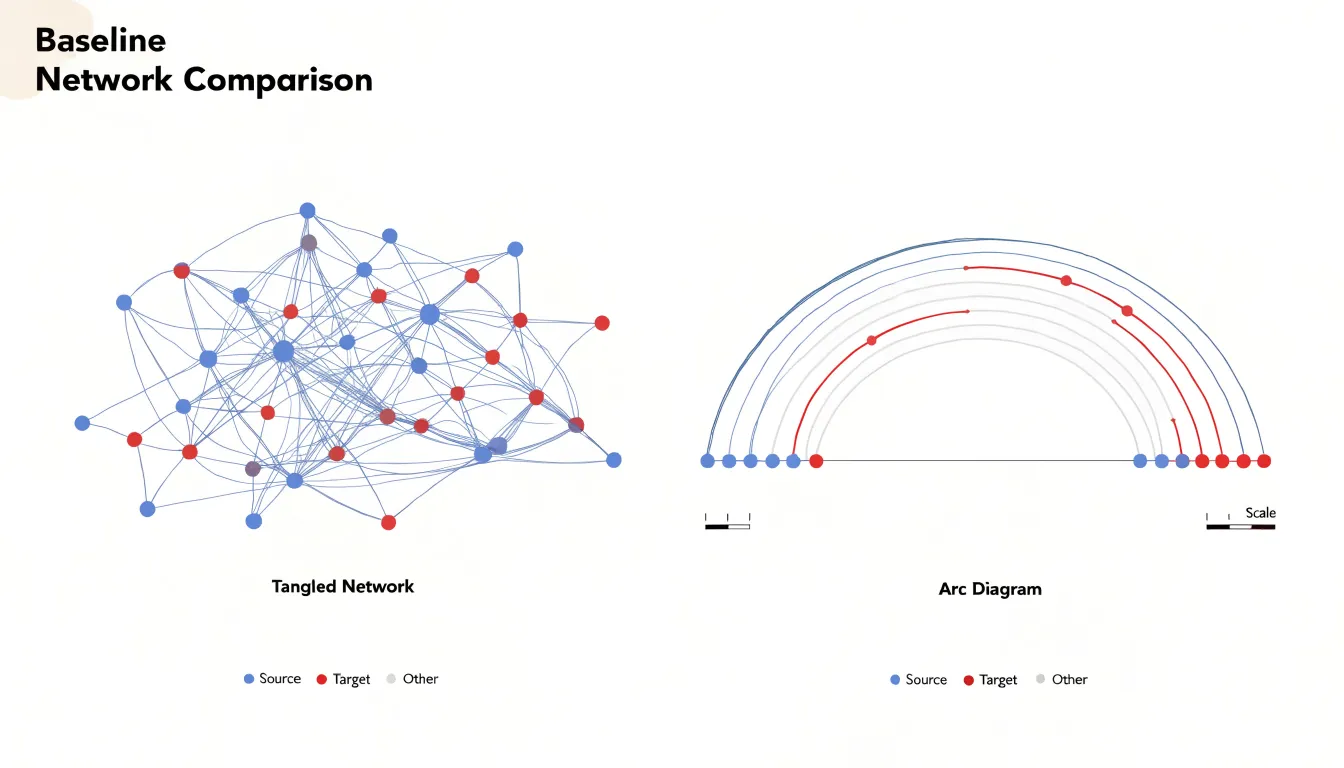
This arrangement pays off in several concrete situations:
- Long-range connections between distant parts of a network are easy to spot because their arcs rise high above the baseline while local links stay low and flat, giving the drawing an immediate sense of scale.
- Sequential or ordered data—such as characters in a text, stations on a line, or records in a file—map naturally onto the axis, so proximity along the line carries meaning the reader already understands.
- Sparse graphs, where each node holds only a handful of links, keep their arcs thin and clean so the whole structure can be read left to right like a sentence.
- Side-by-side network comparisons work well because a shared baseline stabilizes the eye.
The trade-offs appear when many edges connect the same cluster of adjacent nodes; their arcs nest inside one another and become difficult to separate. Dense graphs with hundreds of overlapping links fare better in a 2D layout, where space is available in every direction. A common remedy in arc diagrams is to fan edges above and below the axis or to color arcs by group, restoring clarity while keeping the one-dimensional discipline.
Arc Diagram
Because an arc diagram places every node along a single baseline, the overall shape of the drawing itself carries structural information. When you scan the baseline from left to right, the density of arcs crossing any given region becomes a visual signal. Nodes that participate in many relationships produce a tall stack of overlapping arcs converging on their position. These highly connected hubs announce themselves simply as the points where arc traffic is heaviest, revealing focal nodes without any need to inspect individual edges or consult a separate degree table.
Clusters emerge in much the same way. When a group of nodes shares many internal relationships, their arcs tend to be short and overlap densely within a narrow stretch of the baseline. When nodes are ordered thoughtfully, these localized communities appear as distinct blocks of concentrated arc activity separated by sparser stretches where few arcs cross. The boundaries between communities often show up as visible gaps in the arc coverage.
The interplay between long and short arcs adds another layer. Short arcs typically indicate close neighbors within a community, while long arcs sweeping across large portions of the diagram connect distant groups and often originate from hub nodes. Following the longest arcs from a dense region shows where that community links to the rest of the network, and tracing several long arcs back to their common origin points toward the nodes acting as bridges between otherwise separate clusters. This combination of dense local bundling and long-range connections lets a reader quickly map both the internal cohesion of communities and the key nodes holding the structure together.
Arc Diagram
Ordering nodes along the axis is the single most consequential decision in constructing an arc diagram. Because every arc spans between two node positions, the node sequence determines which arcs must cross over one another. Two strongly related nodes placed at opposite ends of the axis will produce a long arc that sweeps across the entire chart, potentially intersecting dozens of other connections. Placing them adjacent yields a short, compact arc that interferes with little else. The goal of node ordering is to arrange the sequence so that arcs remain short, crossings are minimized, and paths remain visually traceable.
A principled approach to this problem draws on spectral ordering techniques. Spectral methods construct a matrix representation of the graph, typically a Laplacian or adjacency matrix, and compute its eigenvectors. Sorting nodes by their values along a dominant eigenvector, often the Fiedler vector, tends to place strongly connected nodes near one another along the axis. This collapses dense clusters of relationships into local bundles of short arcs, while the remaining long-range connections become visually prominent and easy to follow.
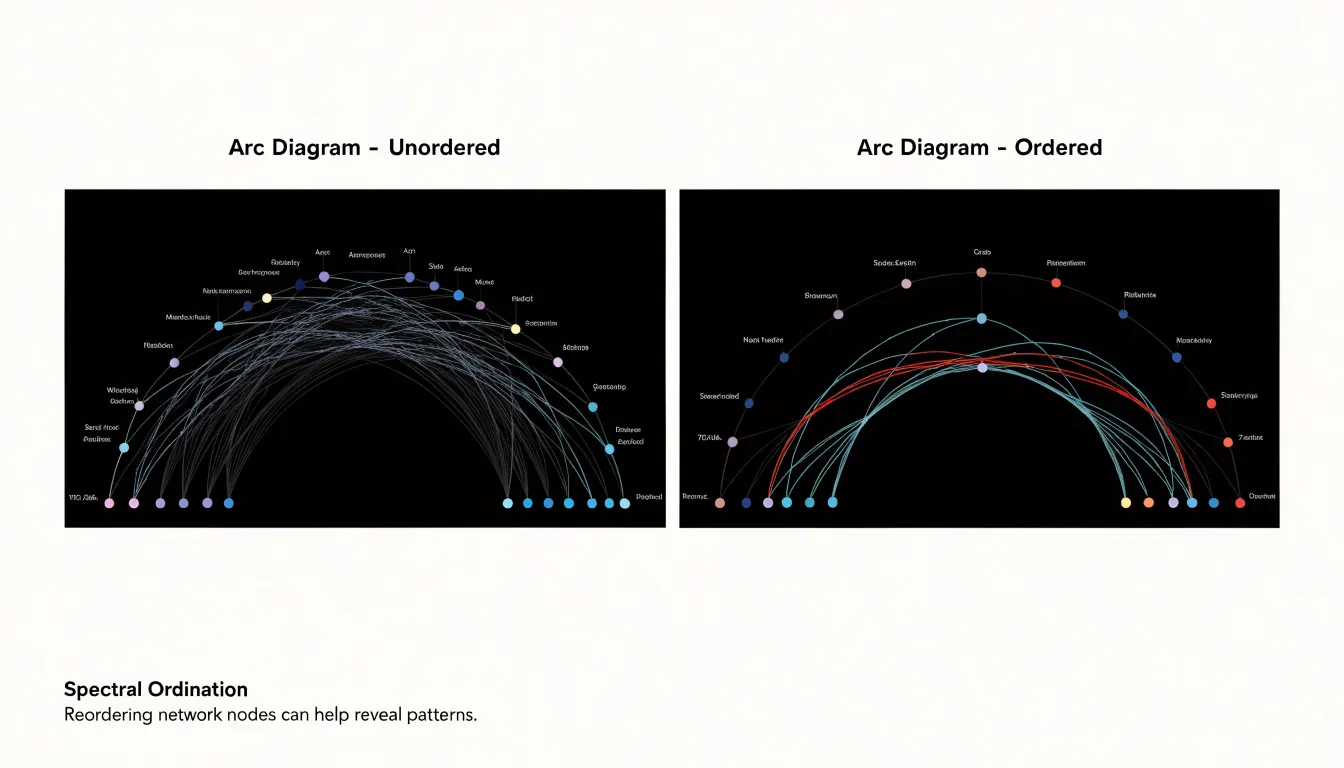
Heuristic grouping offers a complementary and often more practical route. These methods cluster nodes by shared attributes, community membership, or connectivity patterns, then order the clusters along the axis and arrange nodes within each cluster according to degree or centrality. Such approaches scale well to large datasets and can be tuned to respect domain-specific groupings, such as category labels or geographic regions. Hybrid strategies that combine clustering with local refinement—swapping adjacent nodes whenever the swap reduces total arc length or crossing count—frequently yield further improvements over either method alone.
Arc Diagram
Variable arc widths give an arc diagram a second dimension of expression beyond the simple presence or absence of a connection, turning a structural diagram into a quantitative one. Stroke thickness offers a direct, perceptually immediate answer to how strong each relationship is: a thin hairline arc signals a faint or occasional link, while a heavy ribbon communicates a dominant, high-volume connection. In traffic analysis, for example, the thickness of an arc joining two stations or intersections can map directly to vehicle counts, passenger flows, or shipment totals, letting viewers instantly identify the busiest corridors.
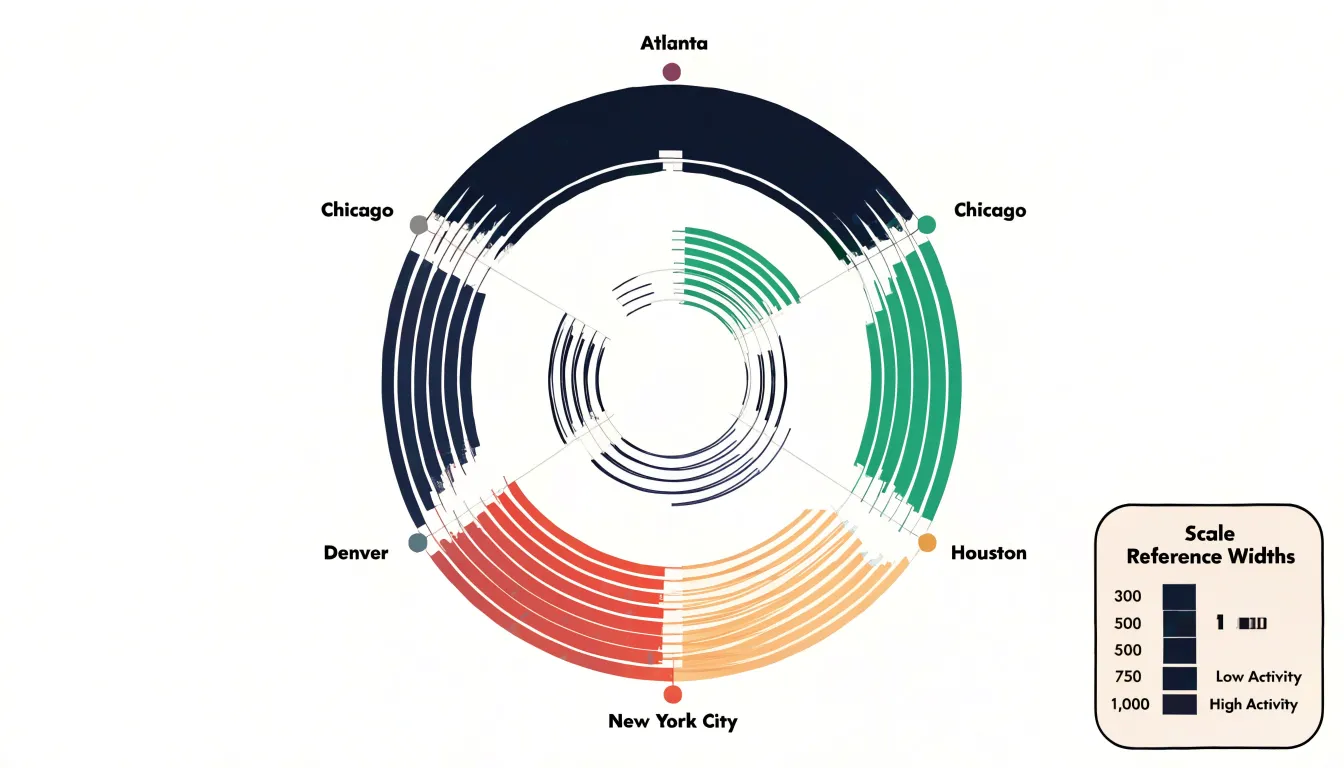
This method requires a consistent mapping rule from data value to visual weight. Most implementations scale stroke width linearly or with a square-root transform against the quantitative field, since very large ranges can otherwise produce arcs so thick they obscure neighboring links or so thin they vanish at small sizes. A scale legend showing reference widths for representative values, such as a few hundred versus several thousand trips, anchors the reader’s interpretation.
Opacity and layering help manage weight in dense areas. Fading low-weight arcs into the background while strong arcs remain visually assertive complements thickness, though it is wise to keep one channel primary so the encoding stays legible. Heavy arcs should sit above lighter ones, and semi-transparent strokes reduce visual clutter where many weighted links cross. Hover interactions that report exact values can then support detailed reading when thickness alone is approximate.
Arc Diagram
Color is one of the most effective tools for separating connection types in an arc diagram, provided it is applied with restraint. Each distinct edge type, source category, or relationship class should receive a single consistent hue reserved exclusively for that category throughout the diagram. Once a reader learns that blue arcs represent citation links and orange arcs represent collaboration links, that association should never be broken in the same view.
Nodes require a parallel strategy. Where arcs carry the category of a connection, nodes can carry the identity of their group, origin, or target. Using the same palette family for both arcs and nodes helps viewers trace a relationship from source to destination at a glance, while a separate, muted treatment for nodes keeps them from competing with the connections themselves.
Several practices help color support clarity rather than clutter:
- Limit the palette to a small number of saturated hues, ideally five to seven, so the display stays legible when arcs overlap. Handle additional categories with lightness or pattern variations rather than entirely new hues.
- Use neutral grays for background or de-emphasized elements, letting colored arcs draw attention to the categories that matter.
- Reduce arc opacity slightly so overlapping connections remain distinguishable while preserving category recognition.
- Include a visible legend mapping each hue to its meaning, grouping entries by relationship type to reinforce the data structure.
Arc Diagram
Arc diagrams become hard to read when designers overlook a few common pitfalls:
- Arbitrary node ordering: Placing nodes in random or unexamined alphabetical order causes arcs to cross chaotically so patterns vanish. Sort nodes by a meaningful metric—degree, category, or a computed seriation—so related nodes sit near each other.
- Excessive edge density: Drawing every possible connection turns the diagram into a hairball. Filter edges by weight or threshold, aggregate parallel edges, or use edge bundling to group similar connections. Interactive highlighting (dimming unrelated edges on hover) also helps readers focus.
- Oversaturated colors: Bright, high-contrast hues across many categories create visual noise. Use a muted palette with a few accent colors, reserve strong hues for the most important categories, and ensure sufficient contrast against the background.
- Overly thick arcs: Heavy lines can obscure node positions and neighboring links. Keep line widths modest and use transparency to reveal overlaps.
Arc Diagram
For arc diagrams, which rely heavily on labels and color coding to convey relationships, accessibility requires careful attention to contrast, typography, screen reader structure, and color selection.
The Web Content Accessibility Guidelines (WCAG) recommend a contrast ratio of at least 4.5:1 for normal text and 3:1 for large text to help readers with low vision or those viewing the diagram in poor lighting. Font sizes should be at least 12 points for body text, with larger sizes for key labels, supported by consistent font families and adequate character and line spacing.
Because relying solely on color excludes readers with color vision deficiencies, choose colorblind-friendly palettes that vary in lightness and saturation, such as those offered by ColorBrewer. Pair hue with secondary cues like direct labels, subtle stroke differences, or dash patterns so categorization survives for every reader.
For screen reader and keyboard users, each arc and its associated label should have clear, descriptive alternative text conveying the relationship shown. Use ARIA roles and properties to define the structure, such as marking the diagram as a figure and providing a content summary. In interactive diagrams, ensure all elements are focusable and keyboard navigation follows a logical order. Finally, test the finished diagram with actual users, including those who rely on assistive technologies, to catch issues automated checks might miss.
Arc Diagram
Static arc diagrams often carry more information than a reader can absorb at a glance. Hover effects and filters address this by letting the viewer pull one thread at a time out of the tangle.
When a cursor moves over a node, the diagram can highlight that node’s connected neighbors and the arcs joining them while fading unrelated arcs to a pale gray. For dense diagrams with dozens or hundreds of edges, this momentary focus state transforms a wall of overlapping curves into something readable, because the eye sees only one node’s local neighborhood at any instant. The same technique works in reverse: hovering over an arc reveals which two nodes it links and what value it represents.
Filtering by edge weight adds a complementary layer of control. When arcs encode a numeric quantity—such as transaction volume, traffic count, or similarity score—a slider or set of thresholds lets viewers hide edges below a chosen cutoff. Progressively stripping away weak connections in real time gives an immediate sense of how the network is structured around its heaviest links. Combined with hover highlighting, filters let users start from the full picture, narrow it down to a meaningful subset, and inspect individual connections within that subset.
Arc Diagram
Preparing spreadsheet data for import into visualization software begins with an edge list. An edge list represents each connection in the diagram as a single row in a flat table, with one column naming the source node, a second naming the target node, and an optional third column carrying a weight or magnitude value. Because every row stands alone and maps cleanly onto one record, import routines can parse the table without manual repair.
To keep the edge list clean and machine-readable, follow these formatting rules:
- Standardize node names: Source and target names must be consistent strings with matching capitalization and spacing so the same node referenced across multiple rows resolves to a single entity rather than fragmenting into near-duplicates. Remove leading and trailing spaces, and avoid characters that the import parser might interpret as delimiters.
- Format weights as pure numbers: The weight column should hold numeric values only, with uniform decimal separators and no embedded units or symbols. If a weight is unknown, leave the cell empty rather than inserting placeholder text that could trigger parser errors.
- Use a single, clean header row: Place one header row at the top of the sheet with plain, unambiguous column names. Remove extra title rows, merged cells, footnotes, and decorative formatting above the data.
- Isolate the table: Save the sheet as a CSV or clean spreadsheet file containing only that single table, with no competing content.
Arc Diagram
When a graph contains hundreds or thousands of connections, three advanced strategies help preserve readability:
- Arc bundling groups multiple arcs between nearby nodes into a single thicker band, reducing visual clutter while still conveying the overall flow of connections. This is particularly useful when many edges share similar paths or connect adjacent regions of the node sequence.
- Thresholding low-weight edges filters out weak or noisy connections below a chosen significance level to highlight the most important relationships, and can be paired with interactive controls so viewers adjust the cutoff themselves.
- Sub-diagrams break extremely large graphs into smaller views, each focusing on a subset of nodes or a local neighborhood. Linked or arranged in sequence and paired with zooming and panning, these sub-diagrams let viewers explore dense connection data incrementally without being overwhelmed.
Arc Diagram
Building an arc diagram starts with choosing an environment that matches your comfort level and data format:
- D3.js (Browser): Offers fine-grained control in a single HTML file. You load link and node arrays as JSON, define a scale mapping node identifiers to evenly spaced x-positions along a baseline, draw a small circle for each node, and bind links to SVG paths. Each path’s
dattribute is computed from a helper returning an arc command likeM x1,0 A r,r 0 0,1 x2,0, where the radius grows with the horizontal distance between endpoints. Styling strokes by weight or direction and adding hover events completes the chart. - Python (NetworkX and Matplotlib): You create a graph object, compute a linear layout by assigning each node an index, and iterate over edges to draw arcs using
matplotlib.patches.Arcor by sampling points along a semicircle with NumPy before plotting a line. Dedicatedarcplot-style packages simplify this further by handling spacing and ordering automatically. - R (
arcdiagramandggplot2): Ideal for small to medium datasets and publication-ready output. You can use thearcdiagrampackage directly or build the geometry manually inggplot2usinggeom_segmentandgeom_curveto connect ranked vertices.
Across all three environments, the workflow is the same: clean and sort the node list, decide whether links are directed or weighted, apply an ordering strategy (such as frequency or alphabetical), and then render and iterate on spacing, line opacity, and labels.
Arc Diagram
Arc diagrams find practical application across domains where sequential order or group hierarchy matters:
- Literary analysis: Researchers plot character co-occurrences along a narrative timeline, drawing arcs between characters who appear in the same scene or chapter. In Vladimir Nabokov’s Lolita, this reveals the intense, claustrophobic focus on Humbert and Lolita while other characters form isolated arcs. Similarly, in the classic Chinese novel Dream of the Red Chamber, arc diagrams have visualized the complex social network of the Jia family, showing interaction clusters and isolated figures.
- Social network analysis: Ordering individuals within an organization along a horizontal axis by department or seniority and drawing arcs between email senders and receivers quickly reveals communication bottlenecks, isolated groups, and cross-hierarchy information flow. For example, such a diagram can show that junior employees communicate frequently among themselves but rarely with senior management, while managers act as bridges between departments.
- Software engineering: Placing codebase modules along the axis in their compiled order with arcs showing import relationships highlights architectural health. A well-structured codebase shows mostly short, local arcs indicating low coupling. Many long arcs spanning distant modules signal high coupling and maintenance difficulties. Tools that generate arc diagrams for Java or Python projects help developers spot cyclic dependencies or “god modules” that everything depends on, supporting refactoring efforts.
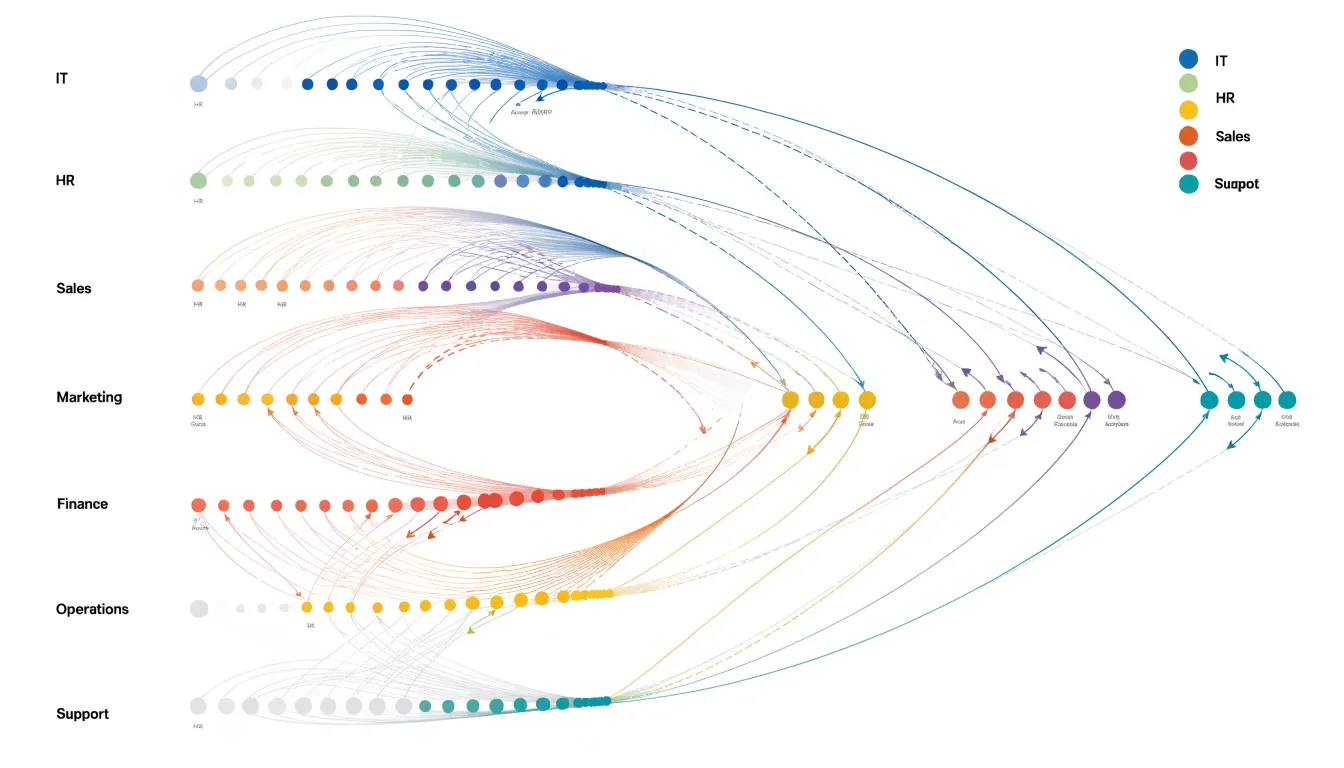
Arc Diagram
In multi-view dashboards, arc diagrams serve as a detailed view of relationships alongside heatmaps, bar charts, or geographic maps that provide context or aggregate summaries. Using coordinated interactions like brushing and linking, selecting a subset of nodes or edges in the arc diagram highlights corresponding data across the other views:
- Bar charts: Placing an arc diagram beside a bar chart that ranks nodes by degree or edge weight lets users cross-reference individual connections with overall counts, or filter the bars to show only categories involved in a selected set of arcs.
- Heatmaps: A heatmap can display connection density over time or other dimensions, while the linked arc diagram reveals the specific node-to-node patterns behind peak periods.
- Geographic maps: Selecting connections in the arc diagram can highlight the physical regions where those connections occur, while the arcs themselves illustrate abstract relationships—such as communication patterns between locations—without cluttering the map geometry.
For effective integration, give each chart a distinct role and maintain consistent color schemes and selection states across every view in the dashboard.
Frequently Asked Questions
What is an arc diagram used for?
An arc diagram is a graph visualization that arranges all nodes along a single horizontal or vertical axis and represents relationships between them as curved arcs. It is particularly effective for showing repeated subsequences, hierarchical relationships, or network structures where the linear order itself carries meaning.
How does an arc diagram compare with a node-link graph?
An arc diagram places all nodes along a single axis, while a traditional node-link graph scatters nodes across a two-dimensional plane. Arc diagrams can make long-range connections easier to spot and help stabilize side-by-side network comparisons, though dense graphs with hundreds of overlapping links may fare better in a 2D layout.
Why does node ordering matter in an arc diagram?
Ordering nodes along the axis is the single most consequential decision because the sequence determines which arcs must cross over one another. The goal is to arrange nodes so arcs remain short and crossings are minimized, using approaches such as spectral ordering or heuristic grouping.
What do thicker arcs and different colors mean in an arc diagram?
Variable arc widths turn a structural diagram into a quantitative one, with thicker strokes representing stronger or higher-volume relationships and thinner strokes signaling fainter links. Color can separate connection types or relationship classes, but it should be applied with restraint, using a consistent hue for each category and a visible legend.
What common mistakes make arc diagrams hard to read?
Common pitfalls include arbitrary node ordering, excessive edge density, oversaturated colors, and overly thick arcs. The article recommends sorting nodes by a meaningful metric, filtering or bundling edges, using a muted palette with few accents, and keeping line widths modest with transparency.
How can I make an arc diagram accessible?
Use sufficient contrast, with WCAG recommending at least 4.5:1 for normal text and 3:1 for large text, and font sizes of at least 12 points for body text. Choose colorblind-friendly palettes and pair hue with secondary cues like direct labels, stroke differences, or dash patterns, because relying solely on color excludes readers with color vision deficiencies; also provide descriptive alternative text, ARIA structure, and keyboard navigation.
Tony Astor
Tony writes about data visualization and the tools people use to build charts and dashboards. More about Data Illustrator