Accessible Data Visualization: A Practical Guide
 By Tony Astor ·

Accessible Data Visualization
Accessible data visualization ensures charts remain readable for people with color vision deficiency, low vision, or motor impairments by never relying on hue alone. Use colorblind-safe palettes, vary luminance and pattern, maintain at least 3:1 contrast for graphics, add direct labels, write descriptive alt text, pair charts with data tables, and support keyboard navigation with 44-pixel touch targets.
Table of Contents
- Color Palette Choices
- High Contrast Elements
- Pattern And Texture Usage
- Text And Typography
- Direct Data Labeling
- Screen Reader Compatibility
- Data Table Alternatives
- Keyboard Navigation Tools
- Interactive Chart Guidelines
- Touch Target Sizes
- Responsive Chart Scaling
- Accessible Motion Effects
- Simplified Layout Structures
- Accessibility Audit Protocols
Color Palette Choices
When selecting a color palette for a data visualization, one of the most consequential decisions is how much meaning to place on hue alone. Roughly one in twelve men and one in two hundred women experience some form of color vision deficiency, and the most common varieties make it difficult to separate red from green or to distinguish certain blues from purples. A palette that relies exclusively on hue differences will therefore leave a meaningful share of any audience unable to read the chart as intended.
A practical starting point is to choose from palettes that have been tested for color-blind safety, such as the Okabe-Ito set or the ColorBrewer schemes explicitly labeled as colorblind-friendly. These palettes are constructed so that adjacent colors remain separable under the most common forms of deficiency, including deuteranopia and protanopia. Where a custom palette is required, a simulation tool can show how the chosen colors collapse together under different vision types, allowing designers to adjust before publishing.
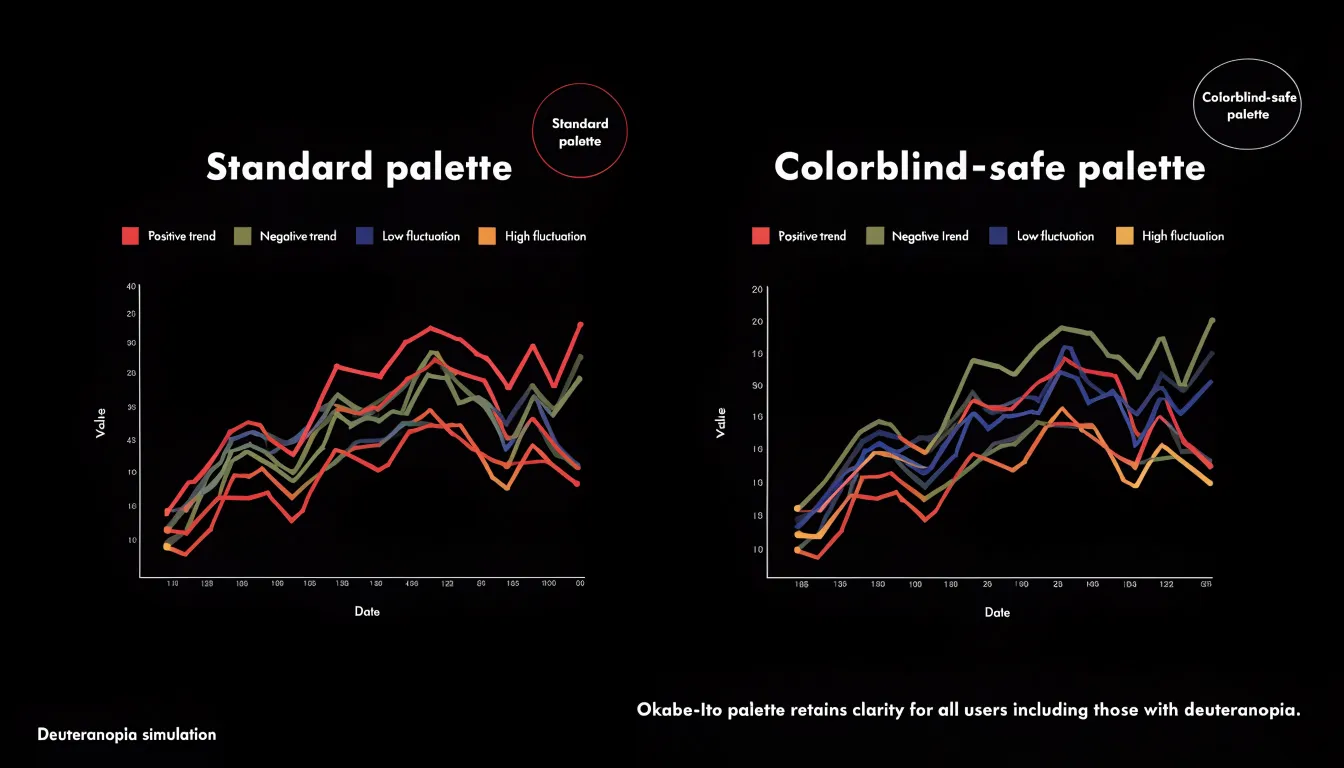
Luminance variation is the most dependable supplement to hue. By ensuring that categories differ noticeably in lightness as well as color, data remains distinguishable even when hue information is lost entirely. A sequential ramp that moves from dark to light, for example, communicates order through value alone. For categorical data, pairing a mid-tone with a clearly darker or lighter companion keeps series separable in grayscale printing and on low-quality screens as well.
Additional redundancy helps further: varying marker shapes, line styles, or adding direct labels means that color becomes one cue among several rather than the sole carrier of meaning. Building these habits into a design process keeps charts readable for everyone, including readers with color vision deficiency, monochrome displays, or poor viewing conditions.
High Contrast Elements
High contrast is a fundamental requirement for making data visualization readable, particularly for people with low vision, age-related vision changes, or conditions such as cataract, glaucoma, or diabetic retinopathy that reduce visual acuity and contrast sensitivity. When foreground elements such as bars, lines, points, labels, and gridlines do not stand out sufficiently from the background, the chart becomes difficult or impossible to parse, regardless of how well the underlying data is structured. Meeting minimum contrast ratios between foreground visual elements and background colors is therefore a core accessibility practice rather than an optional aesthetic refinement.
Contrast ratio is a numerical measure of the difference in relative luminance between two colors, expressed on a scale from 1:1 for identical colors up to 21:1 for pure black against pure white. Accessibility standards such as WCAG recommend a minimum ratio of 3:1 for graphical objects and user interface components, and 4.5:1 for normal-sized text. Data marks deserve careful attention because a thin line or a small scatter point covers little area and offers fewer pixels for the eye to resolve; these elements benefit from stronger contrast than large filled areas. Text labels, axis tick marks, legends, and annotations should be checked against the specific background they sit on, including colored bands or shaded regions within the chart.
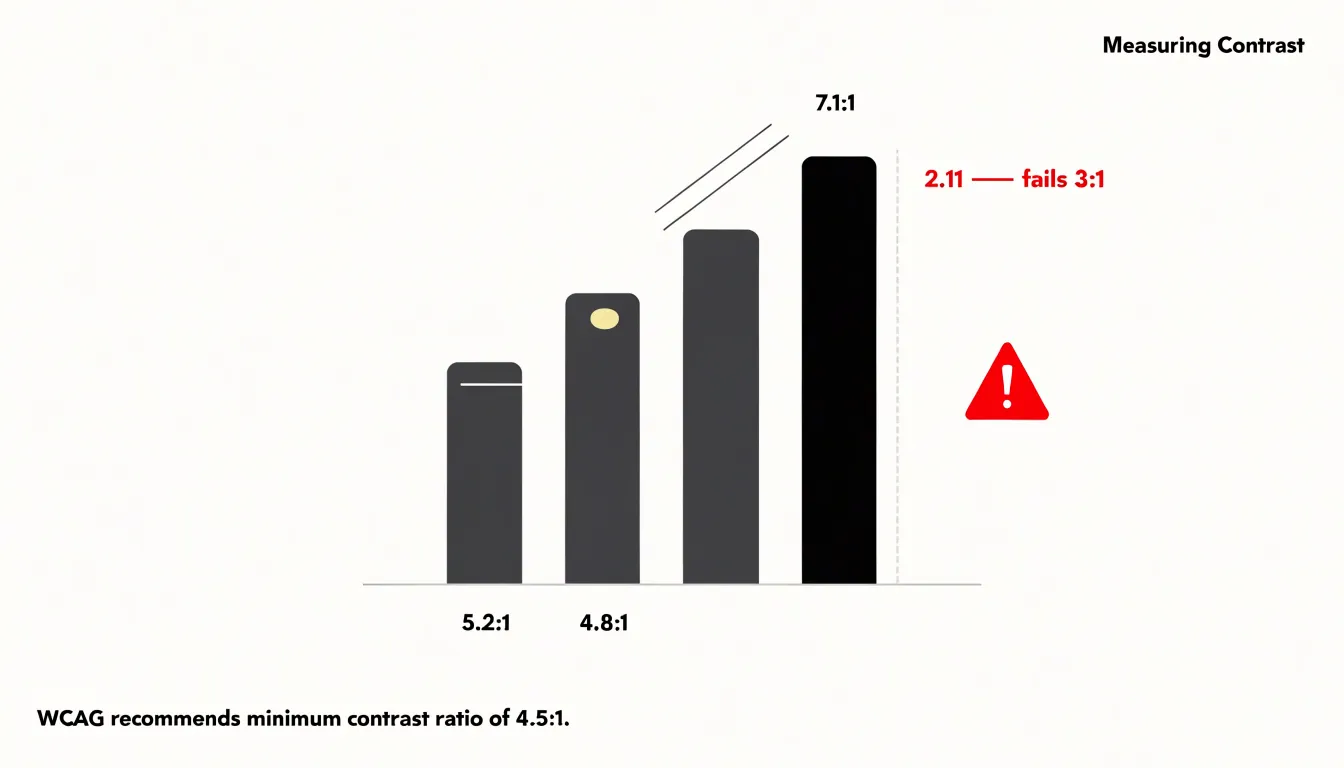
Placing light marks on dark backgrounds or dark marks on light backgrounds consistently, rather than mixing both within one view, supports predictable reading. Testing tools that compute contrast ratios can verify compliance before publication, and checking charts under simulated low-vision conditions reveals problem areas. Sufficient contrast also supports readers viewing charts on low-quality projectors, in bright sunlight, or on screens with reduced brightness, extending legibility to a wide range of real-world contexts.
Pattern And Texture Usage
Pattern and texture fill an important role in separating multiple data series, especially for bar charts where each category or series can carry its own visual signature. Stripe patterns running at different angles, dot patterns with varying density, and crosshatch textures all provide immediate visual differentiation. A bar filled with diagonal stripes reads as distinct from one filled with evenly spaced dots, even when both are printed in grayscale or viewed on a screen where hues appear similar. The key is to choose patterns that differ in more than one dimension, pairing a change in pattern type with a change in scale or spacing, so that the distinction remains visible at small sizes and low resolution.

Line charts benefit from an analogous approach applied to stroke rather than fill. Distinct line styles, such as solid, dashed, dotted, and dash-dot combinations, allow several series to share a single plot area without confusion. Varying line weight and marker shape alongside the dash pattern adds a second layer of differentiation, which helps when lines cross or run close together. Thicker dashes with wider gaps stay legible when a chart is scaled down, while very fine dotting can blur into a solid line on lower-quality displays or printed copies.
Consistency across a document matters as much as the patterns themselves. Once a series is assigned a pattern, that pattern should follow it through every chart, legend, and table in the publication. A legend that shows the pattern directly beside the series name reinforces the mapping, and patterns that appear in the legend should match the chart exactly in orientation and density.
Text And Typography
Readable charts depend on typography that supports quick scanning, and font selection is the foundation of that effort. Sans-serif typefaces such as Arial, Helvetica, Verdana, Tahoma, and system UI fonts like Segoe UI or Roboto offer clean, unornamented letterforms with consistent stroke widths. These characteristics help readers with low vision, dyslexia, or cognitive differences decode labels without the visual noise that decorative serifs or script fonts can introduce. When choosing a typeface, prioritize clear differentiation between similar characters such as the numeral 1, the lowercase l, and the uppercase I, since ambiguous glyphs slow down interpretation of axis ticks and data callouts.
Font size plays an equally important role in chart legibility. Titles and subtitle text should sit comfortably at 16 to 20 pixels or larger, while axis labels and annotations generally work best between 12 and 14 pixels. Text smaller than 12 pixels becomes difficult to read on lower-resolution displays or when charts are embedded in dense dashboards, and it often fails accessibility contrast checks when anti-aliasing thins the strokes. Providing a minimum size floor across every text element in a visualization keeps the chart usable when users zoom or resize their browser windows.
Line spacing, or leading, affects how easily multi-line titles, legends, and annotation blocks can be read. A line height of roughly 1.4 to 1.6 times the font size gives letters room to breathe while preserving the visual grouping of related text. Tightly packed lines cause ascenders and descenders to collide, and overly loose spacing makes readers lose their place. Combined with generous letter spacing in all-caps labels, these typographic choices ensure chart text remains scannable for the widest possible audience.
Direct Data Labeling
Placing data labels directly adjacent to data points or chart elements reduces cognitive load by eliminating the need to cross-reference a separate legend. When a reader encounters a chart with a legend, they must first locate the legend, identify the symbol or color, and then map that information back to the relevant data point. This back-and-forth scanning consumes working memory and slows comprehension, especially when multiple series or categories are present.
Direct labeling removes this step entirely. By positioning the label—such as a category name or value—right next to the corresponding point, line, or bar, the viewer can grasp the meaning in a single glance. This immediate, unambiguous connection is particularly beneficial for readers with cognitive disabilities, limited attention spans, or those viewing charts on small screens where legends may be far from the data.
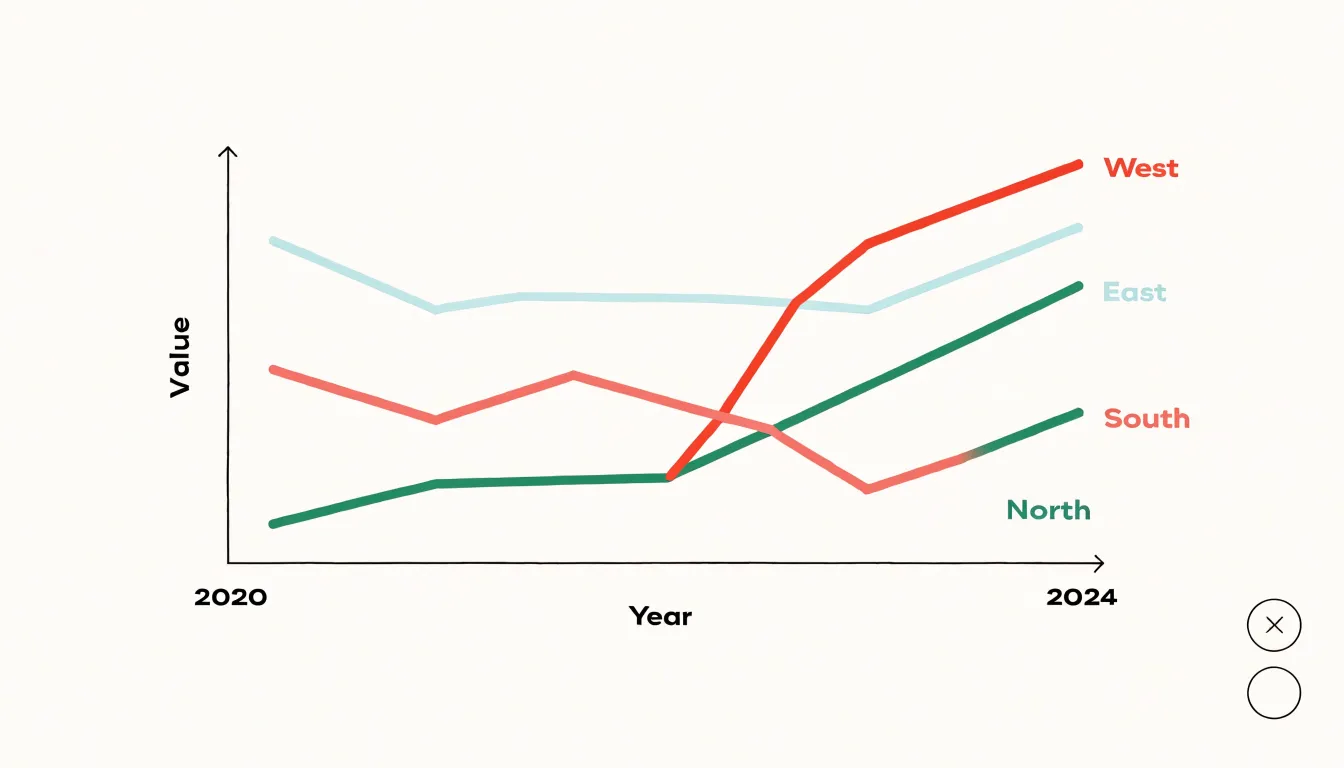
For example, in a line chart showing trends across several regions, placing the region name at the end of each line avoids the need for a color-coded legend that requires constant mental matching. Similarly, in a bar chart, labeling each bar with its category name directly beneath or above it eliminates the need for a separate axis or legend. Direct labeling also reduces the risk of misidentification when colors are similar or when the chart is printed in grayscale, making the visualization more self-contained and easier to interpret.
Screen Reader Compatibility
Descriptive alternatives for charts and graphs require deliberate attention to what the visual actually communicates. A screen reader user encounters an image element and hears whatever text has been attached to it, so the alt attribute becomes the entire experience of that graphic. For a simple bar chart the pattern is straightforward: name the chart, describe its axes, then state the most important comparison or outlier. For a complex visualization with many series, overlays, and annotations, the descriptive text needs to summarize the story rather than inventory every data point. Write the alt text as if explaining the chart to someone over the phone: begin with the chart type and subject, mention the range of the axes, and then surface the two or three insights a sighted reader would walk away with, such as a sharp increase in one category or a consistent decline across another.
ARIA labels extend this practice into interactive and dynamically rendered graphics. When a visualization is built with SVG or canvas and updated by JavaScript, hidden text elements paired with roles and labels let assistive technology announce changes as they happen. A live region can report values as a user navigates through data points, and descriptive labels on individual marks give context to each segment. The goal is to mirror the information hierarchy of the visual, keeping the summary at the top level and the detail available on demand.
Length and precision matter. Alt text that runs too long overwhelms a listener, while vague descriptions like “a chart image” leave the data inaccessible. A useful practice is to draft the alt text before building the chart, since that forces clarity about the central message. Pair the alt summary with a data table or downloadable file so readers can reach the underlying numbers. Reviewing the output with an actual screen reader catches phrasing that reads awkwardly or labels that fire in the wrong order, ensuring the description genuinely serves the people relying on it.
Data Table Alternatives
Pairing complex charts with structured HTML data tables gives every reader a path into the underlying dataset. A chart compresses a great deal of information into shape, color, and position, which works well for many sighted users. When the same numbers are also available in a well-formed table, the information becomes reachable through keyboard navigation and screen reader commands that announce row and column headers, cell values, and table dimensions. A screen reader user can move cell by cell, hear that a value belongs to the “Q3” column and the “North Region” row, and build the same understanding a sighted reader gains from scanning the visual.
The table also serves sighted users who simply prefer exact values. Analysts checking a specific figure, journalists verifying a claim, and readers comparing close numbers all benefit from seeing the precise data rather than estimating from bar heights or line slopes. Placing the table near the chart, often in a collapsible disclosure element, keeps the visual layout clean while leaving the raw numbers one interaction away.
Structured markup matters as much as the table’s presence. Proper <table> elements with <caption>, <thead>, <tbody>, and header cells marked with scope attributes let assistive technology interpret the grid correctly. Avoid layout tables or div-based grids that look like tables visually but carry no semantic relationships. Include a concise caption or summary that describes what the table contains and how it relates to the chart above it. For very large datasets, consider offering a summarized table plus a link to a downloadable CSV so the page stays manageable. When charts and tables appear together, the visual and numeric representations reinforce each other, and no reader is forced to rely on a single mode of access.
Keyboard Navigation Tools
Keyboard navigation transforms a static chart into an explorable space for people who cannot use a mouse. The foundation is a logical tab order: each chart receives a single tab stop, and once focused, users move through data points with the arrow keys rather than tabbing through dozens of individual elements. This pattern keeps the rest of the page navigable while giving the chart its own internal geography.
Left and right arrows typically step through a series on a line or bar chart, while up and down arrows move between series or hierarchical levels. Home and End keys jump to the first and last point, and Escape exits the chart entirely. Each focused point should announce its label, value, and series through an ARIA live region so screen reader users hear the same information sighted users read visually. Shortcuts such as Enter to open a detail panel or Space to toggle a data series give keyboard users parity with hover and click interactions. Visible focus indicators are essential so the current point is unmistakable against the chart background, and tooltips triggered by focus should persist until focus moves.
Testing with a screen reader and keyboard alone reveals problems that mouse-based checks miss, such as focus trapped inside a canvas element or announcements that fire too rapidly as users arrow across dense data. Grouping points into navigable clusters, offering a table view as an alternative, and documenting the shortcuts in an accessible help panel all reduce the learning curve.
Interactive Chart Guidelines
Interactive features that make a chart engaging for mouse users can become barriers for keyboard and switch-device users when they rely on hover alone. Designers should ensure every data point, segment, or series that can be hovered can also receive focus through the Tab key or, for dense charts, through arrow-key navigation within a single focusable container.
Each focusable element needs a high-visibility focus ring, typically two to three pixels thick with strong contrast against both the chart background and the data marks themselves. Where focus lands on a thin line or a small dot, consider rendering the ring as an outline offset slightly from the mark so the indicator remains legible without swallowing the data.
Tooltips should appear as soon as focus arrives and persist for the duration of the focus state, rather than depending on a timing delay that suits pointer movement. The tooltip content should duplicate or supplement the information conveyed by the mark, including the category label, the value, and units. Positioning requires care: tooltips should be placed on the side of the mark with the most available space, flipping automatically near chart edges, and they should never cover adjacent data points or axis labels needed to interpret the focused value. Semi-transparent backgrounds can help preserve context, but contrast for the tooltip text itself must remain at accessible levels.
Finally, test these states with a keyboard only, at various zoom levels, and with a screen magnifier, checking that the focus ring stays visible and the tooltip remains anchored to the correct mark.
Touch Target Sizes
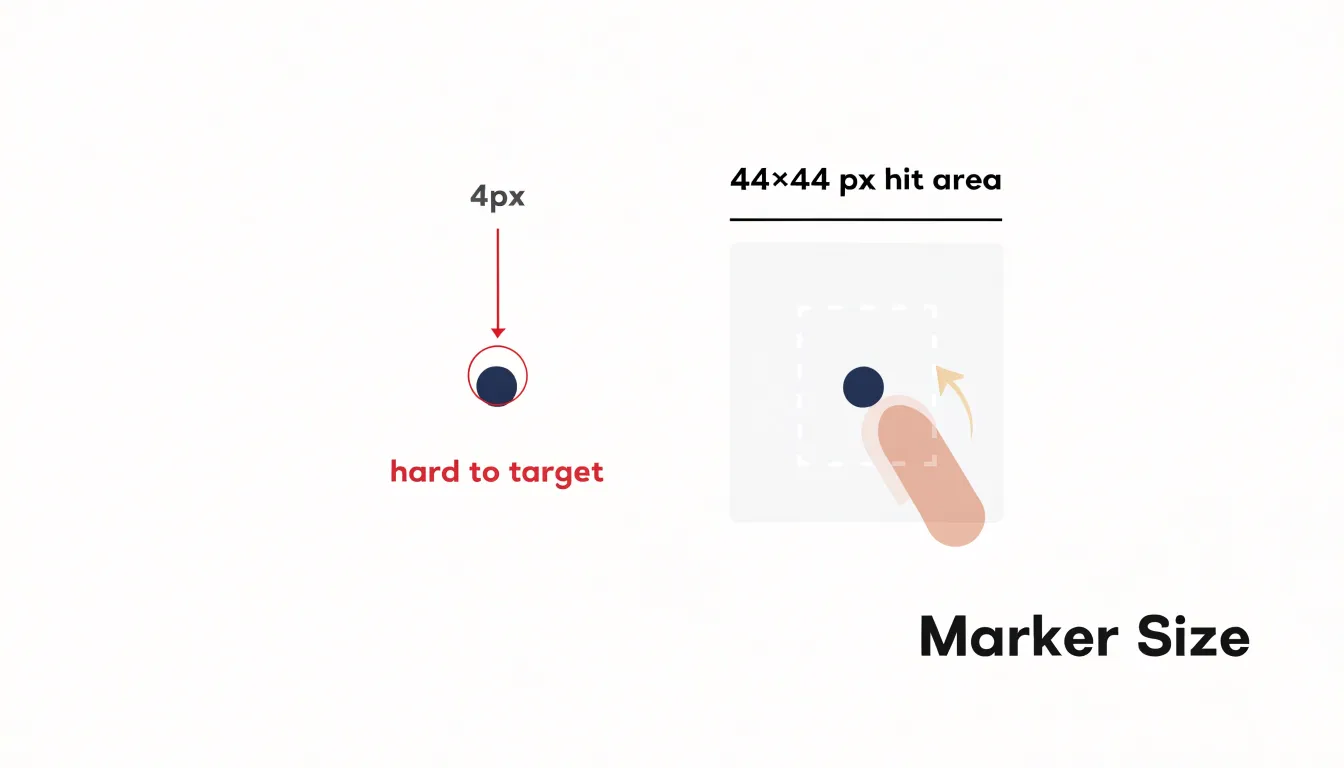
Touch target sizing deserves attention early in the design process for interactive visualizations. Widely cited guidance recommends that any element meant to be clicked or tapped should measure at least 44 by 44 pixels. This figure comes from research into human motor performance, reflecting the reality that a fingertip spreads across a contact patch of roughly nine to ten millimeters. A data point rendered as a four-pixel dot leaves the user guessing where the actual hit area begins and ends, whereas sizing targets to at least 44 pixels gives that contact patch somewhere to land reliably.
The guidance matters just as much for desktop users with motor tremors, arthritis, or other conditions that affect fine pointer control. Someone with a persistent hand tremor may struggle to hold a cursor steady over a small scatter plot marker even with a mouse, and the same is true for users navigating with switch devices, eye trackers, or head pointers. Enlarging the interactive region reduces the precision required for every selection, lowering error rates and shortening task completion times.
A useful technique is to separate the visual mark from its hit area. A small circle can remain visually small while an invisible overlay or an SVG element with a larger bounding box captures the click. Charts built on canvas can use geometry-based hit testing that accepts any pointer within a generous radius of each point. Spacing between adjacent targets also matters, since tightly packed hit areas overlap and reintroduce targeting problems. Where points cluster densely, consider aggregation or zoom interactions rather than shrinking targets below the recommended minimum.
Responsive Chart Scaling
Responsive chart scaling begins with choosing a vector-based rendering format. SVG describes graphics as geometric shapes and paths rather than pixels, meaning a chart remains crisp at any magnification level. When a user zooms a page to 400%, an SVG chart redraws itself at the new scale instead of stretching into a blurry raster image. This resolution independence is the foundation for readable labels, distinguishable data points, and intact axis lines at high zoom levels.
Paired with SVG, fluid layout techniques allow the chart container to resize with the viewport and user zoom settings. Percentage-based widths, viewBox attributes, and max-width constraints let a chart shrink gracefully on a narrow phone screen and expand on a desktop monitor without clipping content or forcing horizontal scrolling. Text elements inside the SVG can scale with the container through relative units, keeping annotations legible when space is tight.
Functionality must survive this reflow as well. Tooltips, focus outlines, and interactive hit targets need to remain reachable and adequately sized when the chart compresses or when the user magnifies the view. Testing at 400% zoom reveals whether labels overlap, whether data points crowd together, and whether any interactive element falls outside the visible area. Where space runs short, charts can switch to simplified layouts, hide secondary gridlines, or reposition legends below the plot. Media queries and container queries support these adaptations, letting the chart respond to its own dimensions rather than only the window size. The goal is a chart that behaves like fluid text: readable, operable, and complete at every scale.
Accessible Motion Effects
Motion in data visualization can guide the eye toward a newly loaded dataset, draw attention to a highlighted series, or smooth the transition between two chart states. For some readers, however, animated effects cross the line from helpful to harmful. Vestibular disorders affect the inner ear and the brain’s processing of balance, and certain kinds of on-screen motion can trigger dizziness, nausea, headache, and disorientation. Large sweeping movements, zooming and panning effects, parallax scrolling, spinning elements, and rapid or erratic transitions are common culprits. Chart animations that fly bars into place from off-screen, bounce data points, or jitter between states can be especially problematic because they combine speed with unpredictability.
The first line of defense is the prefers-reduced-motion media query. Operating systems let users declare that they want minimal animation, and CSS exposes this preference so authors can respond. When that preference is set, animations should be shortened, simplified, or removed entirely. In practice this means transitioning charts instantly between states, disabling auto-playing carousels or looping effects, and replacing movement-based emphasis with static cues such as color, labels, or outlines. Motion should never be the only signal that communicates a change, since readers who suppress animation still need to perceive what happened.
Beyond respecting the media query, designers should treat calm as the default. Easing curves can be gentle, durations brief, and transformations limited to small shifts in position or opacity rather than dramatic travel across the viewport. Any animation that runs longer than a moment or repeats automatically deserves scrutiny, and replay should always be under the user’s control. Testing charts with reduced motion enabled helps catch abrupt or disorienting transitions before they reach vulnerable readers.
Simplified Layout Structures
Simplified layout structures begin with a deliberate approach to visual hierarchy, ensuring that the most important information in a chart or graphic is encountered first and with the least effort. Every element on the page—whether a title, data series, axis label, or footnote—carries a hierarchy level. When all of these elements compete at similar visual weight, the reader must expend cognitive effort sorting through them before reaching the actual message. Establishing a clear hierarchy means giving prominence to headlines and key figures through size and position while progressively muting supporting details such as legends, source notes, and secondary labels. This ordering allows readers to move through the graphic in a predictable sequence.
Limiting unnecessary grid lines is one of the most effective ways to calm a layout. Heavy or dense grid lines add visual noise that competes with the data itself, and for readers with attention-related or sensory sensitivities, that background texture can become genuinely distracting. Reducing grid lines to a few faint reference marks, or removing them entirely where data labels already convey the values, keeps attention on the information rather than the scaffolding around it. The same principle applies to borders, drop shadows, and decorative backgrounds that serve no communicative purpose.
Highlighting key takeaways gives readers a clear destination within the graphic. A short annotation, a callout, or a single emphasized data point can communicate the central message without requiring interpretation of the full chart. For neurodivergent readers, this explicit guidance reduces ambiguity and the working memory load involved in holding multiple values in mind while forming a conclusion. When the takeaway is stated directly, readers can engage with the underlying detail at their own pace.
Accessibility Audit Protocols
An accessibility audit for data visualization works best as a layered process, where automated tools, assistive technology testing, and direct user feedback each catch problems the others miss. Automated checkers such as axe and WAVE provide a fast first pass. They scan rendered pages for missing alternative text, insufficient color contrast, malformed ARIA roles, missing form labels, and structural issues like heading order. Running these tools early in development, and again after each significant change, establishes a baseline and clears away mechanical violations that are cheap to fix. WAVE’s visual overlay is particularly useful for spotting contrast and labeling problems in charts embedded in dashboards, while axe integrates into CI pipelines so regressions are flagged before release.
Automated tools, however, cannot judge whether a chart’s description conveys the right insight. That requires testing with actual assistive technology. Testers should walk through each visualization using NVDA or JAWS on Windows, VoiceOver on macOS and iOS, and TalkBack on Android, confirming that titles, axes, legends, data tables, and interactive controls are announced in a logical order and with meaningful labels. Keyboard-only navigation deserves equal attention to verify that tooltips, filters, and drill-down interactions are reachable and operable without a mouse.
The final layer is testing with real users, including people who rely on screen readers, magnification, voice control, or switch access. Their feedback reveals friction that compliance checklists overlook: confusing announcement sequences, ambiguous summaries, or interactions that technically pass but remain frustrating in practice. Combining automated scanning, assistive technology testing, and lived-experience feedback produces a defensible WCAG compliance position and visualizations that genuinely work for every reader.
Frequently Asked Questions
How common is color vision deficiency, and how does it affect chart color choices?
Roughly one in twelve men and one in two hundred women experience some form of color vision deficiency, and the most common varieties make it difficult to separate red from green or certain blues from purples. A palette that relies exclusively on hue differences will leave a meaningful share of the audience unable to read the chart as intended.
What contrast ratio should charts meet for accessibility?
WCAG recommends a minimum ratio of 3:1 for graphical objects and user interface components, and 4.5:1 for normal-sized text. Thin lines and small scatter points benefit from stronger contrast than large filled areas because they offer fewer pixels for the eye to resolve.
How can I distinguish data series if I can’t rely on color?
Vary patterns and textures, line styles, marker shapes, and add direct labels so color becomes one cue among several rather than the sole carrier of meaning. Luminance variation, such as moving from dark to light, is the most dependable supplement to hue.
What font sizes should I use for accessible chart text?
Titles and subtitle text should sit comfortably at 16 to 20 pixels or larger, while axis labels and annotations generally work best between 12 and 14 pixels. Text smaller than 12 pixels becomes difficult to read on lower-resolution displays or when charts are embedded in dense dashboards.
How do I write alt text for a complex chart?
Write the alt text as if explaining the chart to someone over the phone: begin with the chart type and subject, mention the range of the axes, and surface the two or three insights a sighted reader would walk away with. For complex visualizations, summarize the story rather than inventory every data point, and pair the summary with a data table or downloadable file.
How can I make chart animations accessible for people with vestibular disorders?
Respect the prefers-reduced-motion media query by shortening, simplifying, or removing animations when that preference is set. Certain on-screen motion—such as large sweeping movements, zooming and panning, parallax scrolling, spinning elements, or rapid transitions—can trigger dizziness, nausea, headache, and disorientation in readers with vestibular disorders, and motion should never be the only signal that communicates a change.
Tony Astor
Tony writes about data visualization and the tools people use to build charts and dashboards. More about Data Illustrator